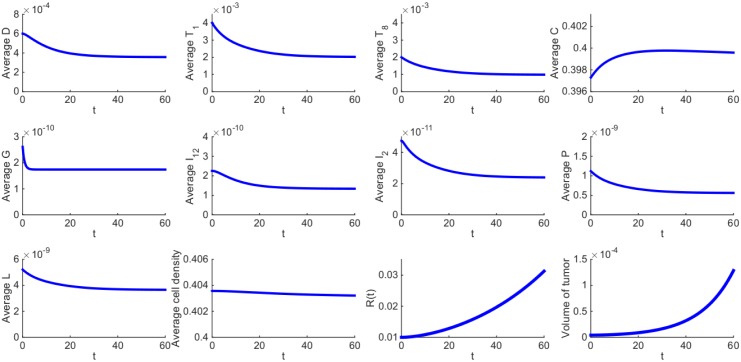
Fig 2. Average densities/concentrations of all the variables in the model in the control case (no drugs).
Figures in the first and second panels and the first figure in the third panel show the average density or concentration of each species in the model. The last three figures in the third panel show the total average density of all cells, the growth of tumor radius and the growth of tumor volume, respectively. All parameter values are the same as in Tables 2 and 3.

