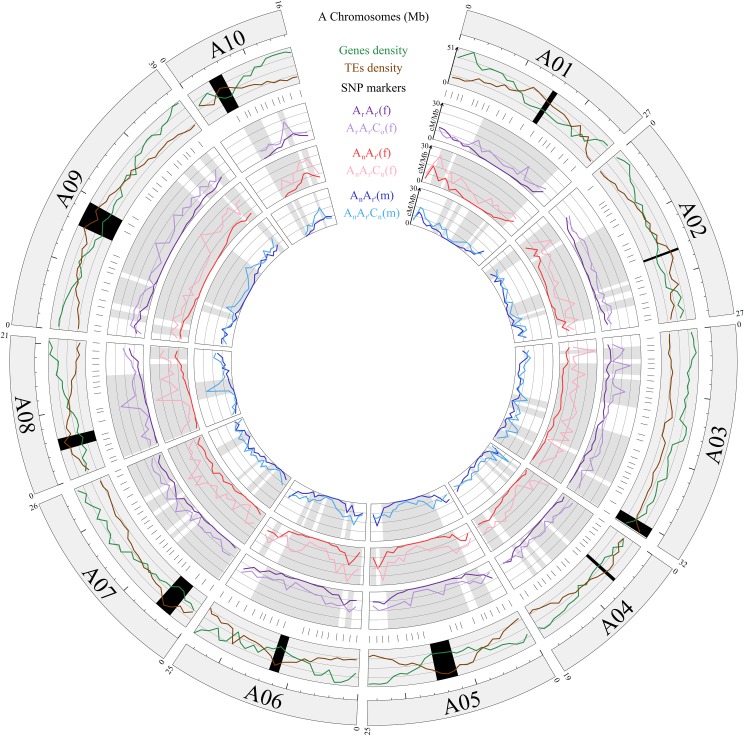
Fig 4. Circos diagram comparing the recombination rates along the 10 A chromosomes in cM per Mbp between the AA and AAC F1 hybrids.
In the first outer circle are represented the 10 A chromosomes of the B. rapa cv. ‘Chiifu-401’ genome sequence version 1.5 [57]. Their sizes are indicated by the values in megabase pairs above each chromosome, and a ruler drawn underneath each chromosome, with larger and smaller tick marks every 10 and 2 Mbp, respectively. In the second outer circle, is detailed the architecture of each A chromosome, including the genes and transposable elements (TEs) densities from the version 1.5 of the B. rapa cv. ‘Chiifu-401’ genome sequence [57]. The active centromeres are delimited in black using the positions established by Mason et al. [81]. In the third outer circle, are indicated the positions of the 204 SNP markers used for the genotyping of the progenies of each AA and AAC F1 hybrid. In the three inner circles, are represented the pair-wise comparisons for the recombination landscapes (in cM per Mb) of progenies deriving from the AA and AAC F1 hybrids. Toward the Circos diagram center, are compared (i) the ArAr’ (purple lines) and ArAr’Co (light purple lines) female hybrids, (ii) the AnAr’ (red lines) and AnAr’Cn (pink lines) female hybrids, and (iii) the AnAr’ (blue lines) and AnAr’Cn (light blue lines) male hybrids. For each interval between adjacent SNP markers, the heterogeneity of CO rates was assessed using Chi-squared tests and significant differences at a threshold of 5% were indicated for each pair-wise comparison between AA and AAC F1 hybrids in grey.

