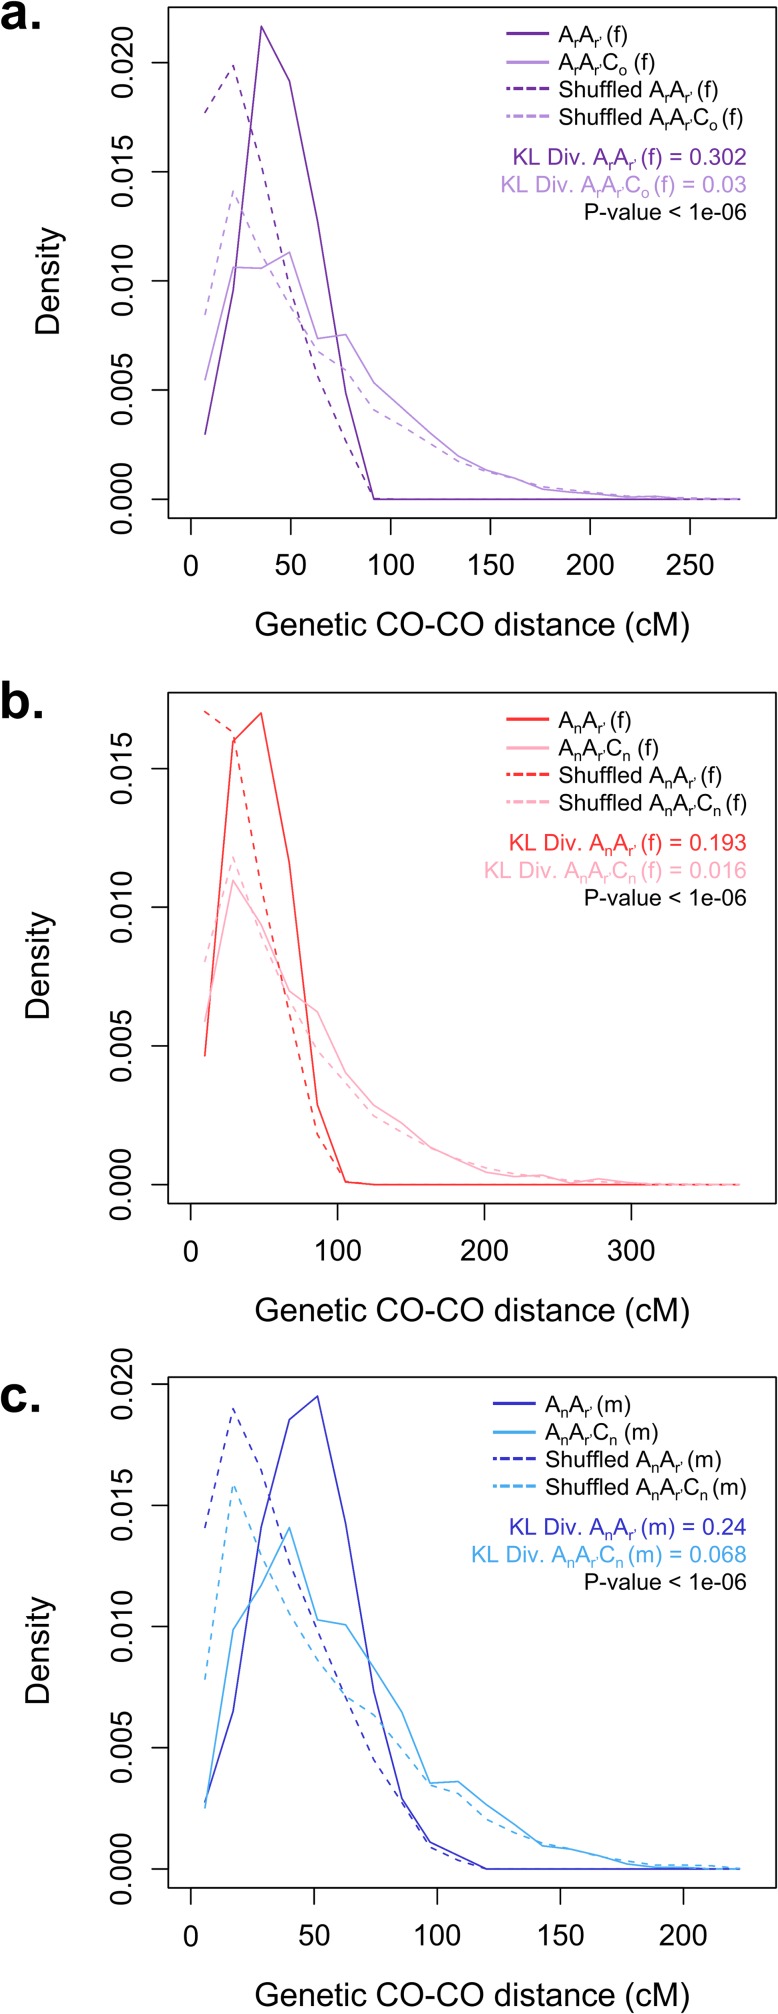
Fig 5. Distributions of inter-crossover genetic distances in AA and AAC F1 hybrids when pooling all 10 chromosomes.
Comparison of the distribution of genetic distances between successive COs from populations deriving of (a) females ArAr’ (in purple) vs ArAr’Co (in light purple), (b) females AnAr’ (in red) vs AnAr’Cn (in pink) and (c) males AnAr’ (in blue) vs AnAr’Cn (in light blue). Data are pooled over the 10 A chromosomes. X-axis: genetic distance between successive COs. Solid lines correspond to experimental data. Dashed lines indicate the corresponding distributions in the "no-interference" situation, obtained by re-shuffling CO positions of experimental data (see Methods). For each population, the Küllback-Leibler divergence (KL Div.) from the experimental to the "no-interference" distribution provides a quantitative measurement of interference strength. p-value: one-sided p-value of the H0 hypothesis that the diploids and allotriploids have the same KL Div. index (and thus interference strength). Sufficiently small values indicate significantly higher interference in diploids than in allotriploids (see details in Methods).

