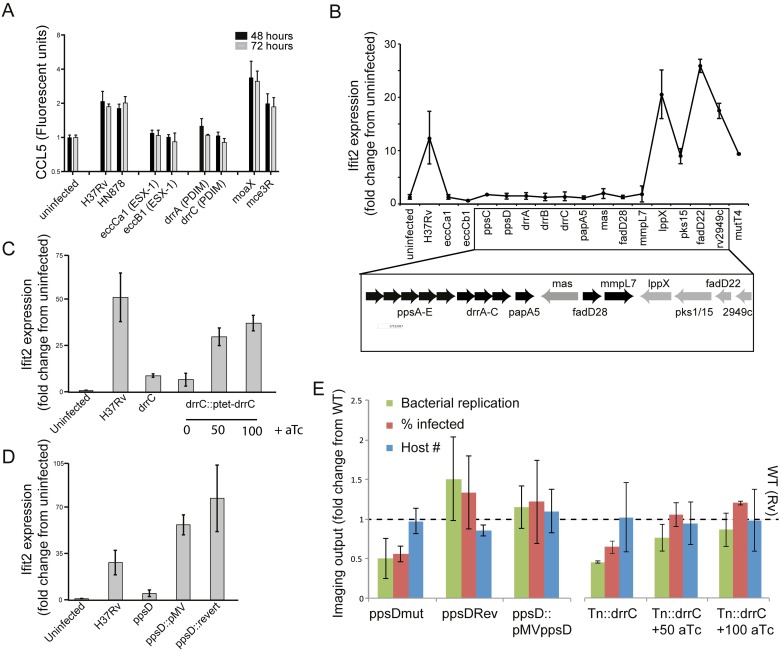
Fig 3. PDIM production and export is required for induction of the macrophage type I IFN response.
(A) Measurement of macrophage CCL5 production after infection with Mtb strains. J774.A1 cells were infected with wild-type Mtb strains or transposon mutants at an MOI of 1:1. Supernatants were harvested at 48 or 72 hours after infection for cytokine quantitation using Luminex. Mean +/- SD of three biological replicates. (B-D) The type I IFN response was measured by quantitation of expression of the type I IFN-responsive gene ifit2 expression after macrophage infection with Mtb. Bone marrow-derived macrophages were infected with the indicated Mtb strains at an MOI of 2:1 and RNA was harvested at 24 hours for gene expression analysis by qRT-PCR. (B) Transposon mutants across the PDIM locus, including synthetic function mutants (ppsC, ppsD, mas), transport mutants (drrA, drrB, drrC, mmpL7), and acyl activating mutants (fadD28) failed to induce expression of type I IFN-responsive gene ifit2. P-value by two-tailed t-test for comparisons of Rv with Tn mutants in eccCb1, eccCa1, ppsC, ppsD, drrA, drrB, drrC, papA5, mas, fadD28, and fadD22 were < 0.05, for the comparison of Rv and mmpL7 was 0.05, and for the comparison of Rv with lppX, pks15, Rv2949c, and mutT4 were non-significant. (C) A drrC transposon mutant was complemented with tetracycline-inducible, chromosomally-integrated drrC; drrC expression was induced with 50ng/ml or 100ng/ml aTc. While in the absence of inducer ifit2 expression was substantially decreased relative to wild-type-infected macrophages, induction of drrC expression with aTc restored ifit2 expression. Two-tailed t-test p-value for the comparison of Rv with Tn::drrC and Tn::drrC::ptet-drrC 0 ng/ml aTc was < 0.01. (D) Infection with wild-type H37Rv, ppsD point mutant ppsD(G44C) that fails to produce PDIM, or complemented mutants ppsD(G44C)rev and ppsD(G44C)::pMVppsD. While loss of functional ppsD in the mutant resulted in loss of ifit2 expression, restoring ppsD function restored ifit2 production. Two-tailed t-test p-value for the comparison of Rv with ppsDmut was < 0.05. (B-D) Mean +/- SD of biological duplicates. (E) Microscopy of macrophages infected with PDIM mutant and complemented strains demonstrates that complementation restores wild-type image analysis phenotypes. J774A.1 macrophages were infected with wild-type, PDIM mutant, or complemented strains. After 3 days of infection, cells were washed, fixed, and stained with DAPI to visualize macrophage nuclei and auramine-rhodamine to visualize Mtb. Cells were imaged and CellProfiler automated image analysis was used [29] to quantitate bacterial fluorescent intensity, percent macrophages infected, and macrophage cell count. Mean +/- SD of six biological replicates.

