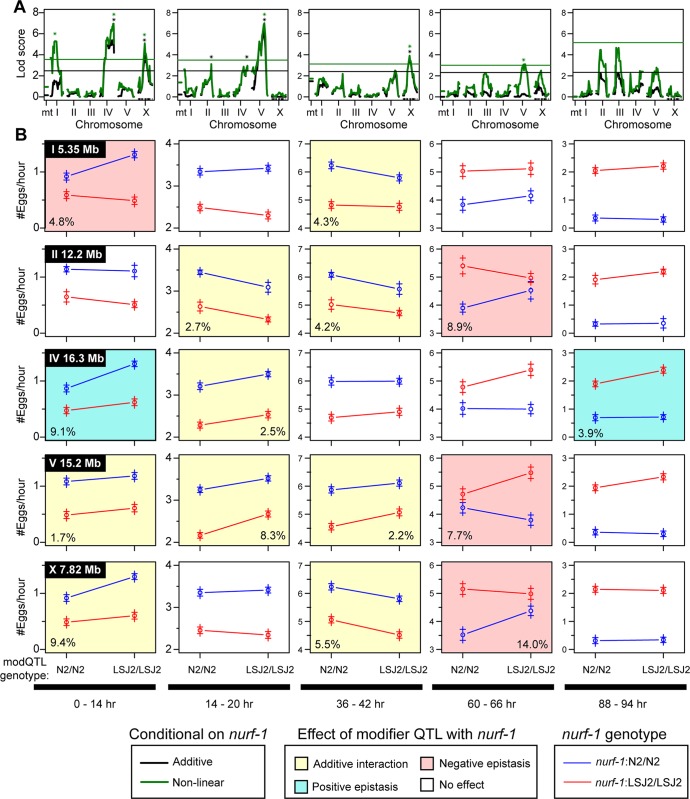
Fig 5. Additional modifier QTLs affect egg-laying in an age-dependent manner.
A. QTL mapping using the nurf-1 genotype as an additive (black) or interactive (green) covariate. Black and green stars indicate the five QTLs with genome-wide significance above 0.05. B. Average egg-laying rate of data from 94 RILs used for QTL mapping in panel A partitioned and averaged by their genotype at nurf-1 and one of the modifier QTLs at five time points. The circle indicates the average egg-laying rate of all of the RILs that share the particular genotype. The plus signs indicate the standard error. The modifier QTL for each row is shown in the upper left of the first panel of each row, and its genotype is indicated on the x-axis. The nurf-1 genotype is indicated by the color of the lines. A non-white background coloring indicates a significant effect of the modifier QTL by ANOVA (p<0.05). A yellow background indicates a significant effect of the modifier QTL but no significant non-linear interaction with nurf-1 by ANOVA (p < 0.05). A blue background indicates a significant effect of the modifier QTL and a significant positive non-linear interaction with nurf-1 by ANOVA (p < 0.05). A red background indicates a significant effect of the modifier QTL and a significant negative non-linear interaction with nurf-1 by ANOVA (p < 0.05) For modifier QTLs with a significant effect, we also included the amount of variance explained by that locus in the bottom left or bottom right corner of the panel.

