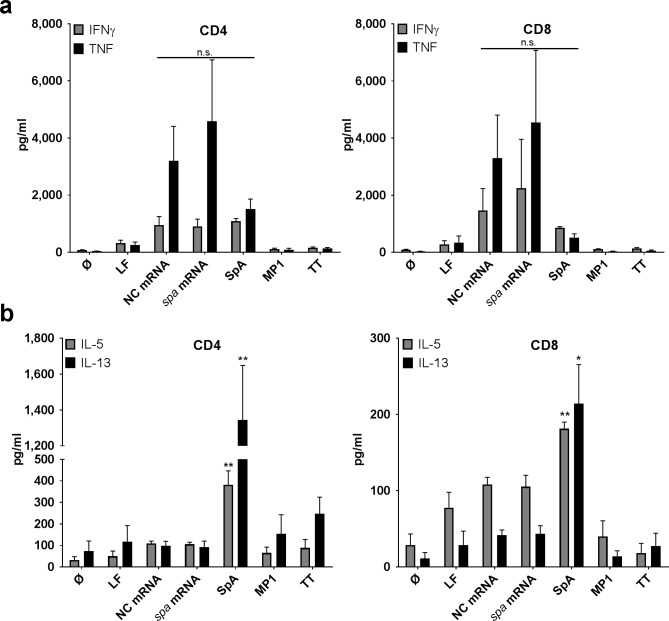
Fig 3. T cell cytokine profiles in response to spa mRNA-encoded and SpA protein delivered antigens.
Cytokine secretion profiles in day 5 supernatants of CD4+ (left panel) or CD8+ T cells (right panel) stimulated with spa mRNA or SpA protein antigens was performed using a multiplex cytokine array: (a) Th1 cytokines (IFNγ, TNF) and (b) Th2 cytokines (IL-5, IL-13). The graphs depict the mean values ± SEM obtained from n = 6 independent donors. Experiments were carried out in duplicates. For Th1 cytokines, one-way ANOVA was used to test significance of multiple conditions; for Th2 cytokines, p values refer to condition with spa mRNA (paired student’s t-test; p**<0.01, p*< 0.05).

