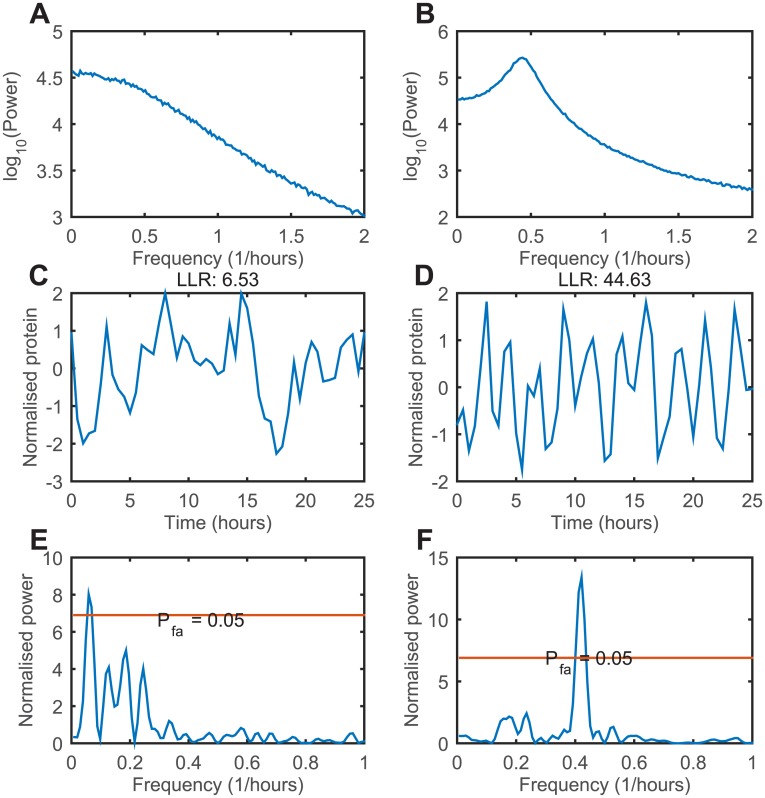
Fig 4. Time series examples from the stochastic Hes1 model.
(A), (B) Power spectra of protein concentrations calculated from 1000 independent Gillespie simulations. Measurements start at t = 5000 mins in order to allow for equilibration. Model parameters for (A) are P0 = 300, h = 1, τ = 0, αm = αp = 1, μm = μp = 0.07 and Ω = 20. Model parameters for (B) are P0 = 100, h = 3, τ = 18, αm = αp = 1, μm = μp = 0.03 and Ω = 20. (C), (D) Time series examples and associated LLR scores from (A) and (B), respectively. (E), (F) LSP of time series (C) and (D), respectively.

