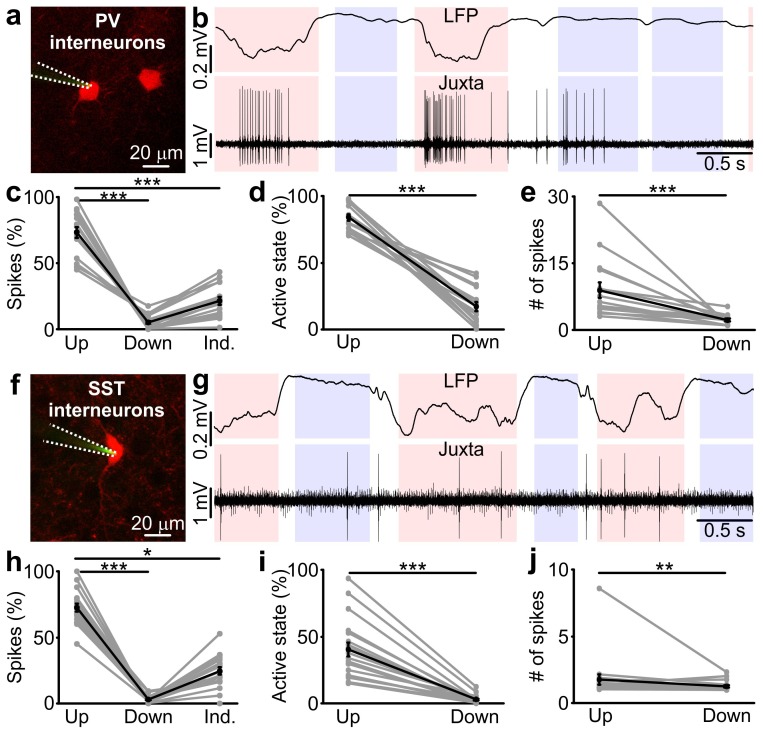
Figure 1. Firing activity of PV and SST interneurons during cortical up and down states in vivo.
(a) Fluorescence image showing a glass pipette (dotted white line) used for juxtasomal recordings from a PV positive interneuron (red cell) in a PVxTdTomato bigenic transgenic animal. (b) Representative traces of simultaneous LFP (top) and juxtasomal (bottom) recordings from an identified PV interneuron during up and down states. Pink and purple colours in the background indicate up and down states that were identified from the LFP signal, respectively. The white background colour indicates indeterminate states (see Materials and methods). (c) Action potentials fired by PV cells in the three identified periods (up, down and indeterminate, p = 7E-8, one-way ANOVA, N = 16 cells from five animals). In this as well in other figures: grey dots and lines indicate single experiment; black dots and lines indicate the average value represented as mean ± s.e.m; n.s., p>0.05; *p<0.05; **p<0.01; ***p<0.001. (d) Percentage of active up states and active down states (p = 3E-16, unpaired Student’s t-test, N = 16 cells from five animals). (e) Number of spikes fired by PV cells per single up or down state (p = 8E-6, Mann-Whitney test, N = 16 cells from five animals). (f–g) Same as in a, b but in SSTxTdTomato bigenic transgenic animals. (h–j) Same as in c-e for SST interneurons. In h, p = 2E-8, Friedman test, N = 19 cells from seven animals. In i, p = 1E-7, Mann-Whitney test, N = 19 cells from seven animals. In j, p = 9E-3, Mann-Whitney test, N = 19 cells from seven animals.
DOI: http://dx.doi.org/10.7554/eLife.26177.002


