. 2017 May 16;6:e26177. doi: 10.7554/eLife.26177

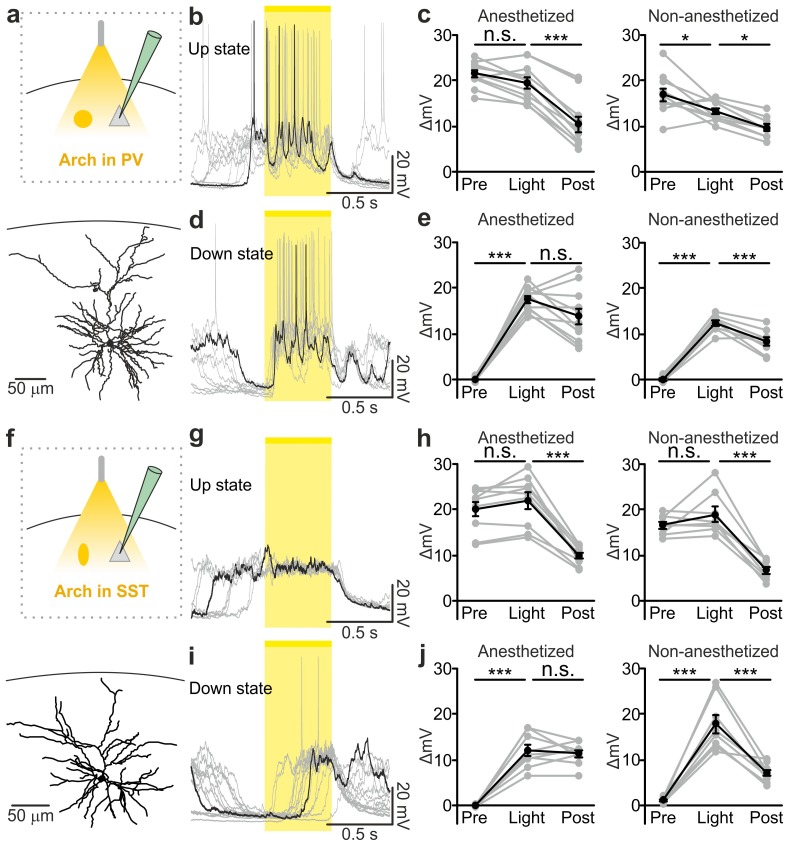
Figure 4. Optogenetic inhibition of PV and SST cells prolongs the up state and triggers down-to-up transitions.

(a) Top: schematic of the experimental configuration. Bottom: morphological reconstruction of a representative recorded neuron. (b) Representative recordings from a pyramidal cell during optogenetic inhibition (yellow line) of PV interneurons during an up state. (c) Change in the membrane potential (ΔmV) of recorded neurons before (Pre), during (Light), and after (Post) optogenetic suppression of PV cells in anesthetized (left) and non-anesthetized (right) mice. Left: p = 3E-8, one-way ANOVA, N = 11 cells from four animals; right: p = 2E-8, one-way ANOVA, N = 10 cells from four animals. (d–e) Same as in b-c but for PV suppression during ongoing down states. In e: left, p = 7E-8, one-way ANOVA, N = 11 cells from four animals; right, p = 2E-6, one-way ANOVA, N = 8 cells from four animals. (f–j) Same as in a-e but for optogenetic inhibition of SST interneurons. In h: left, p = 1E-6, one-way ANOVA, N = 9 cells from five animals; right, p = 7E-7, one-way ANOVA, N = 8 cells from five animals. In j: left, p = 1E-6, one-way ANOVA, N = 9 cells from five animals; right, p = 2E-5, one-way ANOVA, N = 8 cells from five animals.

DOI: http://dx.doi.org/10.7554/eLife.26177.028

Figure 4—source data 1. Source data for the analysis of membrane potential changes during photoinhibition of PV or SST interneurons.
DOI: 10.7554/eLife.26177.029

Figure 4.

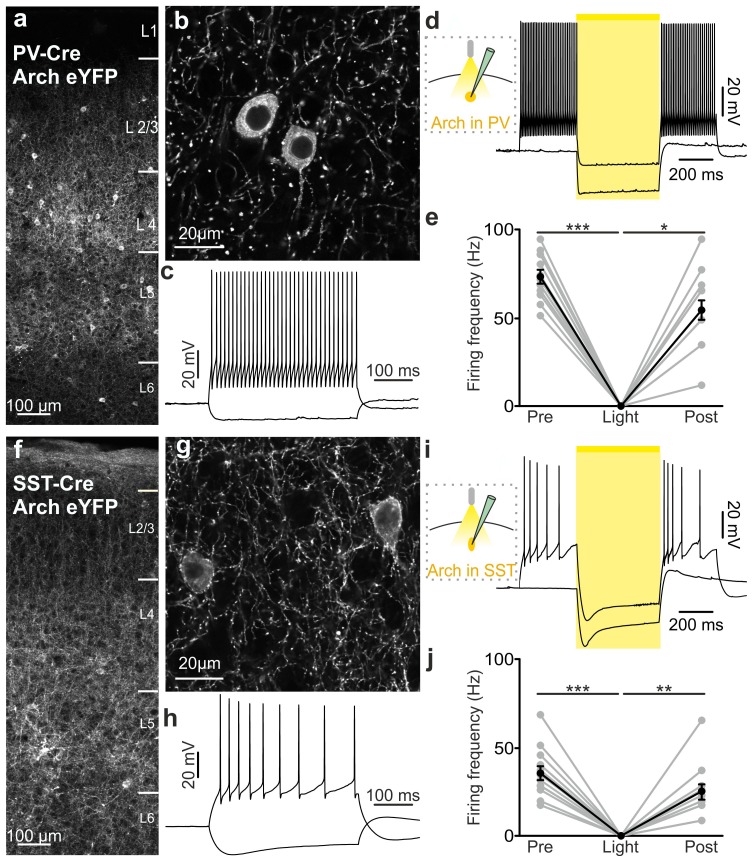
Figure 4—figure supplement 1. Functional analysis of PV and SST positive cells expressing Arch.

Figure 4—figure supplement 1.

(a–b) Confocal images of coronal cortical sections showing the expression of Arch-eYFP in PV-Cre mice. (c) Representative current-clamp patch-clamp recordings in slices, showing the typical firing pattern of a PV cell that was also positive for Arch. (d) Left: schematic of the experimental configuration. Right: membrane potential response to 500 ms of light stimulation. AP discharge was induced by current injection. (e) Quantification of the average firing frequency before (Pre), during (Light), and after (Post) light stimulation (p = 9E-6, Friedman test, N = 13 cells from four animals). (f–j) Same as in a-e but for SST positive interneurons that express Arch. In j, p = 2E-5, Friedman test, N = 13 cells from six animals.
Figure 4—figure supplement 1—source data 1. Source data for functional characterization of PV and SST interneurons expressing Arch.
DOI: 10.7554/eLife.26177.031
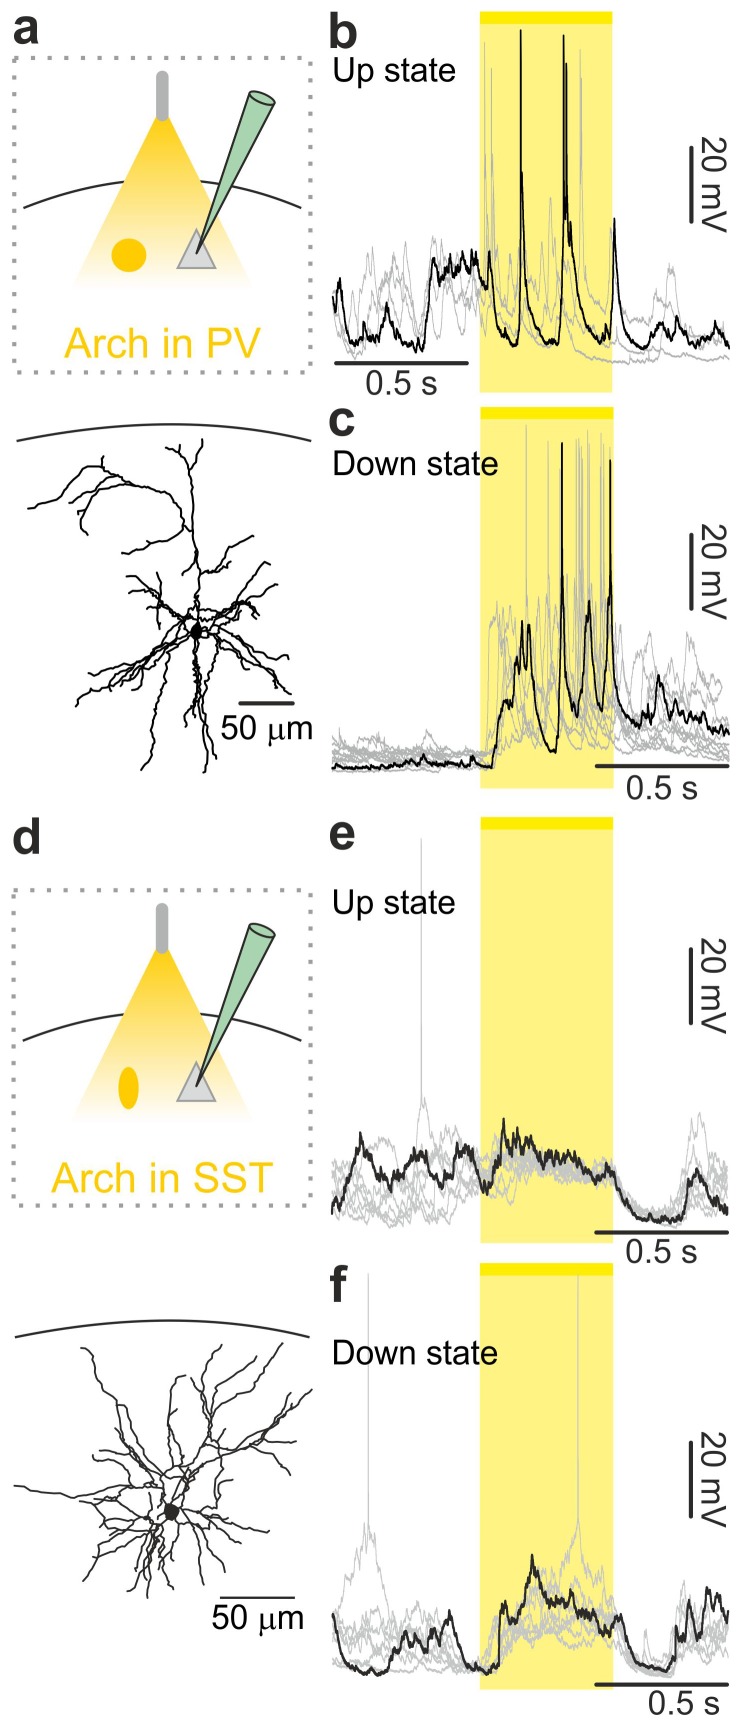
Figure 4—figure supplement 2. In vivo intracellular recordings of spontaneous cortical dynamics and photoinhibition of PV or SST positive interneurons in non-anesthetized animals.

Figure 4—figure supplement 2.

(a) Top: schematic representation of the experimental configuration. Bottom: morphological reconstruction of a recorded layer II/III pyramidal neuron. (b) Representative intracellular recordings showing the effect of the optogenetic inhibition of PV interneurons on the membrane potential of the recorded pyramidal neuron when light (yellow line and shadow) was delivered during up states in a non-anesthetized mouse. (c) Same as in b but for optogenetic inhibition of PV interneurons during down states. (d–f) Same as in a-c but in mice expressing Arch in SST interneurons.
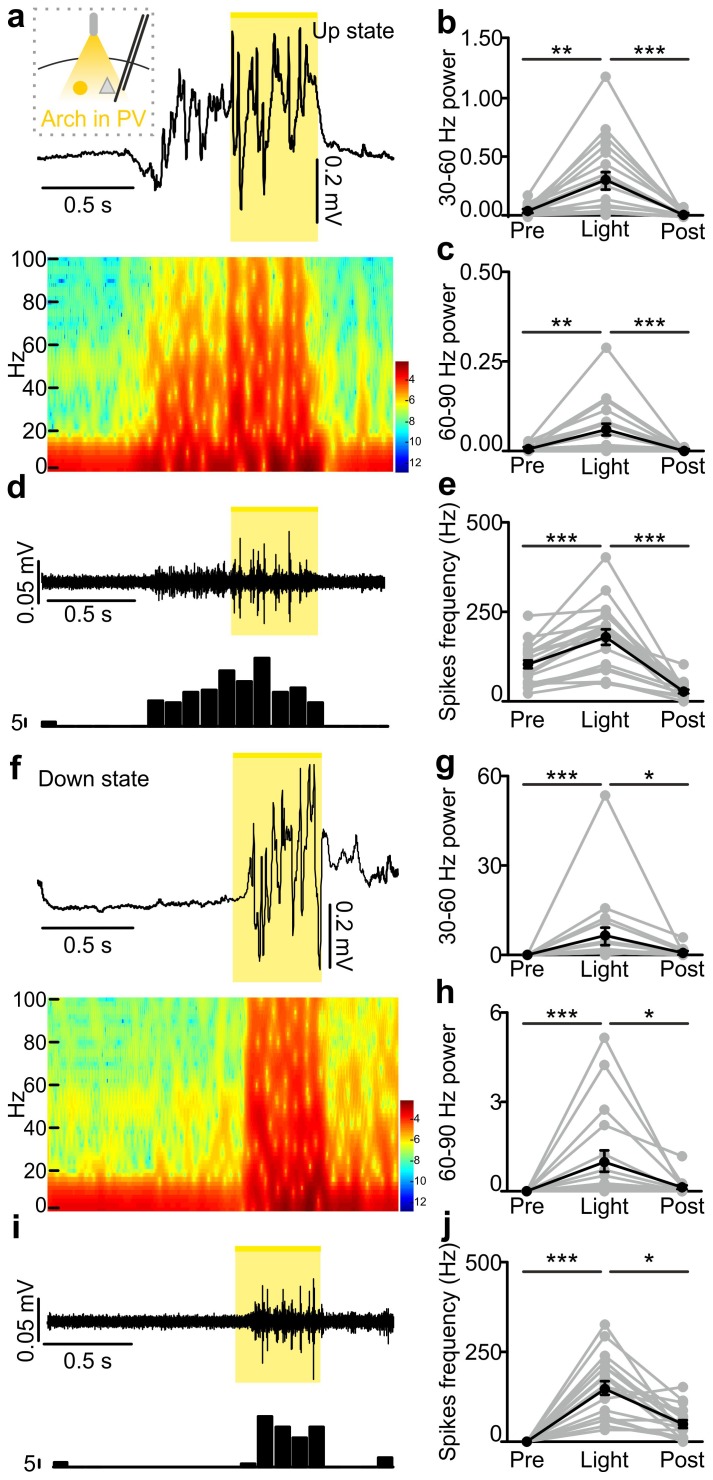
Figure 4—figure supplement 3. In vivo extracellular recordings of spontaneous cortical dynamics and photoinhibition of PV positive interneurons expressing Arch.

Figure 4—figure supplement 3.

(a) Representative trace of an in vivo LFP recording (top) and corresponding spectrogram (bottom) showing the effect of optogenetic stimulation (yellow line) of PV interneurons expressing Arch during an ongoing up state. The schematic of the experimental configuration is shown in the inset (top panel). (b–c) Average power in the 30–60 (b) and 60–90 (c) Hz frequency band before (Pre), during (Light) and after (Post) light stimulation. Power values are normalized to the total power in the ‘pre’ time window. In b, p = 1E-7, Friedman test, N = 19 animals. In c, p = 9E-9, Friedman test, N = 19 animals. (d) Multi-unit signal (top) and corresponding PSTH (bottom) related to the trace showed in a. (e) Average firing frequency of spikes (Hz) recorded in the multiunit signal before (Pre), during (Light), and after (Post) light stimulus (p = 1E-7, one-way ANOVA, N = 19 animals). (f–j) Same as in a-e but for photoinhibition of PV positive interneurons during an ongoing down state. In g, p = 1E-8, Friedman test, N = 19 animals. In h, p = 2E-8, Friedman test, N = 19 animals. In j, p = 3E-8, Friedman test, N = 19 animals.
Figure 4—figure supplement 3—source data 1. Source data for the effect of PV photoinhibition during up states on network activity.
DOI: 10.7554/eLife.26177.034
Figure 4—figure supplement 3—source data 2. Source data for the effect of PV photoinhibition during down states on network activity.
DOI: 10.7554/eLife.26177.035
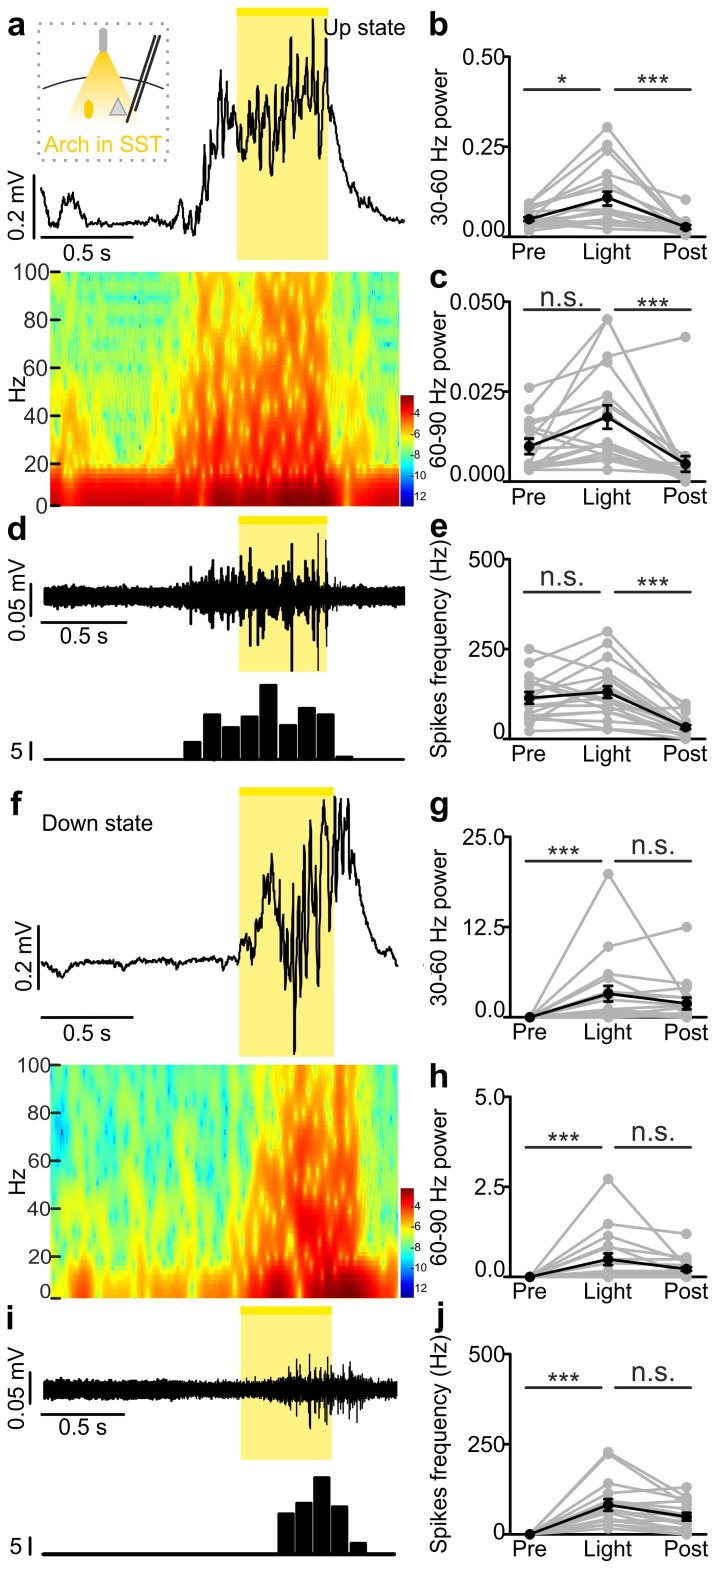
Figure 4—figure supplement 4. In vivo extracellular recordings of spontaneous cortical dynamics and photoinhibition of SST positive interneurons expressing Arch.

Figure 4—figure supplement 4.

(a) Representative trace of an in vivo LFP recording (top) and corresponding spectrogram (bottom) showing the effect of optogenetic stimulation (yellow line) of SST interneurons expressing Arch during an ongoing up state. The schematic of the experimental configuration is shown in the inset (top panel). (b–c) Average power in the 30–60 (b) and 60–90 (c) Hz frequency band before (Pre), during (Light), and after (Post) light stimulation. In b, p = 3E-7, Friedman test, N = 18 animals. In c, p = 3E-6, Friedman test, N = 18 animals. (d) Multi-unit signal (top) and corresponding PSTH (bottom) related to the trace showed in a. (e) Average firing frequency of spikes (Hz) recorded in the multi-unit signal before (Pre), during (Light), and after (Post) light stimulus (p = 4E-6, Friedman test, N = 18 animals). (f–j) Same as in a-e but for optogenetic inhibition of SST interneurons during an ongoing down state. In g, p = 1E-6, Friedman test, N = 18 animals. In h, p = 3E-7, Friedman test, N = 18 animals. In j, p = 3E-7, Friedman test, N = 18 animals.
Figure 4—figure supplement 4—source data 1. Source data for the effect of SST photoinhibition during up states on network activity.
DOI: 10.7554/eLife.26177.037
Figure 4—figure supplement 4—source data 2. Source data for the effect of SST photoinhibition during down states on network activity.
DOI: 10.7554/eLife.26177.038