Figure 2.

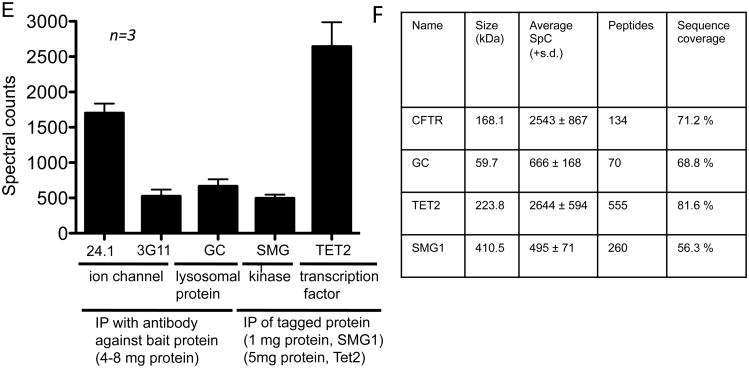
High sensitivity of CoPIT. A. Western blot depicting improved recovery of ΔF508 CFTR from CFBE41o- cells with TNI in comparison with different lysis buffers. A,B,C indicate the different CFTR glycoforms. B. Western blot showing enhanced recovery of ΔF508 CFTR from beads after Co-IP with detergent and heat aided low pH elution in comparison to other directly mass spectrometric compatible elution methods. Lane Wang et al. 2006: Elution conditions as described in Wang et al., 2006 41. Gly. Glycine C. Enhanced sensitivity of the CFTR Co-IP and chromatography is reflected by enhanced spectral counts for CFTR itself and well-established interactors like HSP70 and HSP90. E. Recovery of baits from different protein classes with CoPIT. Data are shown as spectral counts for the bait in independent biological triplicates. Error bars indicate standard deviation. The starting amount is given below as number of cells that were lysed for CoPIT. F. Table showing the performance of CoPIT for proteins of different classes and molecular weights giving the average of recovered spectral counts per experiment, and sequence coverage.
Figure 2 A-C is taken from Pankow, Bamberger et al. 2015 24.

