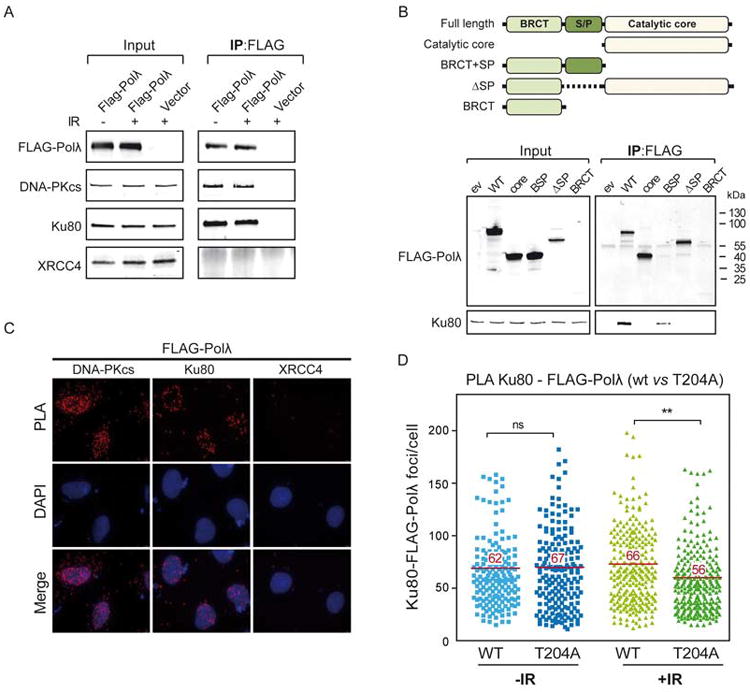
Figure 7. Polλ interacts with Ku80 and DNA-PKcs.

(A) 293T cells transfected either with FLAG-empty or FLAG-POLL plasmids were mock irradiated or irradiated with 10 Gy of IR to induce nonspecific DSBs. One hour later, whole cell extracts were prepared and FLAG-Polλ was immunoprecipitated with anti-FLAG antibody (IP) in the presence of 20 U/mL benzonase and immunoblotted (IB) with the indicated antibodies. Input samples are 10% (v/v) with respect to IP samples. (B) 293T cells transfected with either FLAG-empty vector or plasmids encoding different FLAG-POLL deletion variants (a scheme is shown at top) were treated as in (A). FLAG-tagged proteins were immunoprecipitated (IP) in the presence of 20 U/mL benzonase, run in 4-20% gradient gels and immunoblotted (IB) as indicated. Input samples are 10% (v/v) with respect to IP samples. (C) Proximity ligation assays were performed to confirm in situ the interactions described in (A) and (B). U2OS cells overexpressing FLAG-Polλ were irradiated with 2 Gy of IR and examined 1 h after irradiation for PLA foci of FLAG (for PolA) and the indicated proteins by immunofluorescence. Nuclei were counterstained with DAPI and the PLA signals (red) were visualized in a fluorescence microscope (scale bars, 7.5 μm). (D) U2OS cells overexpressing either FLAG-Polλ or FLAG-Polλ-T204 were mock irradiated or irradiated with 2 Gy of IR, and examined 1h after irradiation for PLA foci of FLAG (for PolA) and Ku80 by immunofluorescence as described in (C). The plot shows quantification of PLA signal per nucleus from three independent experiments (at least 150 cells scored). Statistical analysis was performed first with Kolmogorov-Smirnov test, which indicates the non-parametric distribution of samples, and with Kruskal–Wallis One-Way test and Dunn's post-test correction, ** p<0.01 compared to wild-type Polλ transfected cells. Lines denote mean values.
