4.
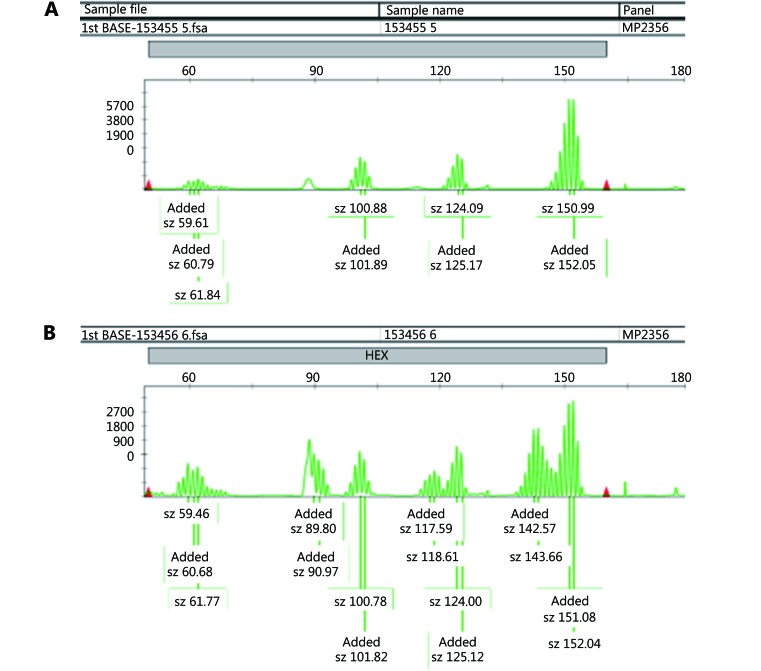
Capillary electrophoresis results from the Promega system. A panel consisting of five mononucleotide marker was used for MSI determination via multiplex PCR. X axis is the size in bases. Y axis is the fluorescence intensity. Green peaks are amplification products from microsatellite loci, including three of five markers shown here (NR21, BAT25, and MONO27). Note the shift in the size (bases) of the amplification products in the tumor specimen compared with normal ones. An example of one shifted locus is demonstrated in the tumor sample (B) compared with normal one (A).

