5.
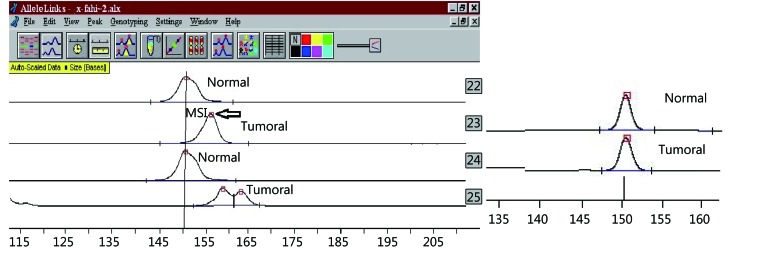
MSI assay by single marker (CAT25) showing instability in tumor tissue (bottom) compared with normal tissue (top). The amplified products were separated by ALF express fragment analysis. Comparison of peak patterns with a shift in PCR product size of the tumor with normal ones represents instability. The arrows represent shifts in base pairs compared with normal tissue. The 22 and 23 lines are normal and tumoral tissues in one patient. The 24 and 25 lines are in another one. One example of MSS status detected by CAT25 marker is shown (right).

