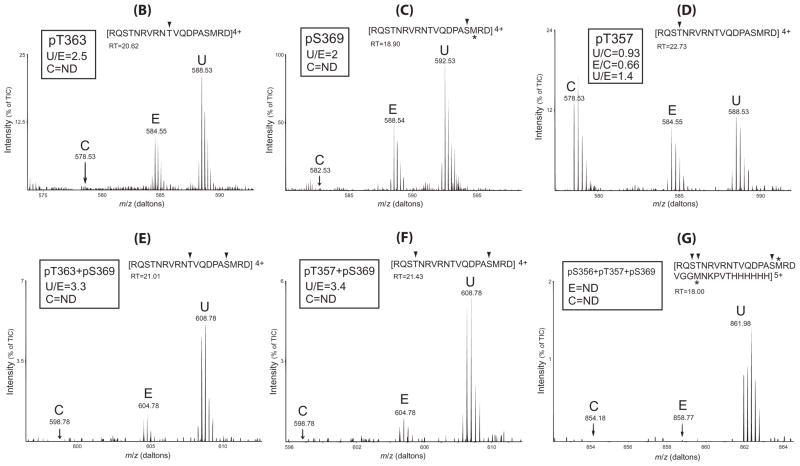
Figure 7. Differential effects of U50,488H and etorphine on KOPR phosphorylation: Determination with SILAC-LC/MS/MS.
(A) Schematic drawing of the experimental procedures. N2A-FmK6H cells were cultured in medium containing regular Arg (Control) (C), Arg6 (etorphine) (E) or Arg10 (U50,488H) (U) for at least 10 passages to label all the proteins. Cells were treated with vehicle, etorphine (1 μM), U50,488H (10 μM) for 30 minutes. Similar numbers of cells from each group were combined and solubilized and mKOPR was purified with Ni-NTA agarose column followed by anti-FLAG affinity column. Eluates were resolved with SDS-PAGE and a broad band of ~52 kDa was excised. In-gel digestion was performed with Glu-C and digested materials were subject to LC-MS/MS for identification and quantitation.
(B–G) phospho-peptide fragments identified and quantitation and relative abundance of the phosphopeptides in control (C), etorphine (E) and U50,488H (U) groups. The peptide fragment detected is shown at the top of each figure with the phosphorylated residue(s) indicated with arrow head. The retention time (RT) of each phosphopeptide in the HPLC run is shown. For each phosphopeptide, the ratio of the amount in the U50,488H sample vs. that in the etorphine sample (U/E) is shown. For the phosphopeptide containing pT357, the ratios of 50,488H/control (U/C) and etorphine/control (E/C) and U/C are shown. Results shown are from one of the two experiments performed with similar results. m/z: mass/charge ratio; ND: not detected; TIC: total ion currents. *: methionine sulfoxide.


