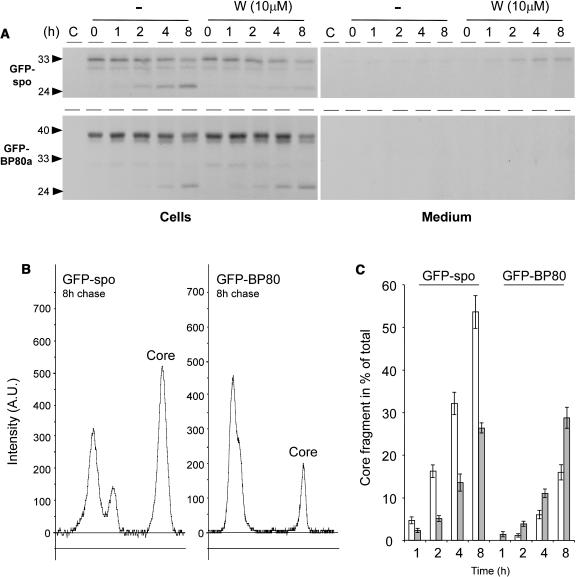
Figure 9.
Pulse-Chase Analysis Demonstrating the Opposite Behavior of GFP-BP80a and GFP-spo in Response to the Drug Wortmannin.
(A) Protoplasts were pulse labeled for 1 h, after which incubation in chase buffer was conducted for times indicated above each lane either in the presence (W) or absence (−) of the drug wortmannin. Isolated medium and cell extracts were immunoprecipitated with the anti-GFP antiserum and separated by SDS-PAGE. Notice that both GFP-spo and GFP-BP80 chase into the GFP core fragment but that this is inhibited for GFP-spo upon incubation with wortmannin.
(B) Line scannings of the 8-h chase points for GFP-spo (left) and GFP-BP80a (right) from phosphor imaging data corresponding to (A) using AIDA software (Raytest). The signal for the GFP core fragment is indicated (Core) in each panel.
(C) GFP core fragment presented as a percentage of the total signal in each lane. Quantification of the GFP core signal bands was in arbitrary units and is presented as a percentage of the total surface area from all peaks in each lane. Percentages are given in function of the time for ligand (GFP-spo) and receptor construct (GFP-BP80) in the absence (white bars) and presence (gray bars) of 10 μM wortmannin. At the 1 h time point, GFP core was undetectable for GFP-BP80 in the absence of the drug.

