
Figure 2.
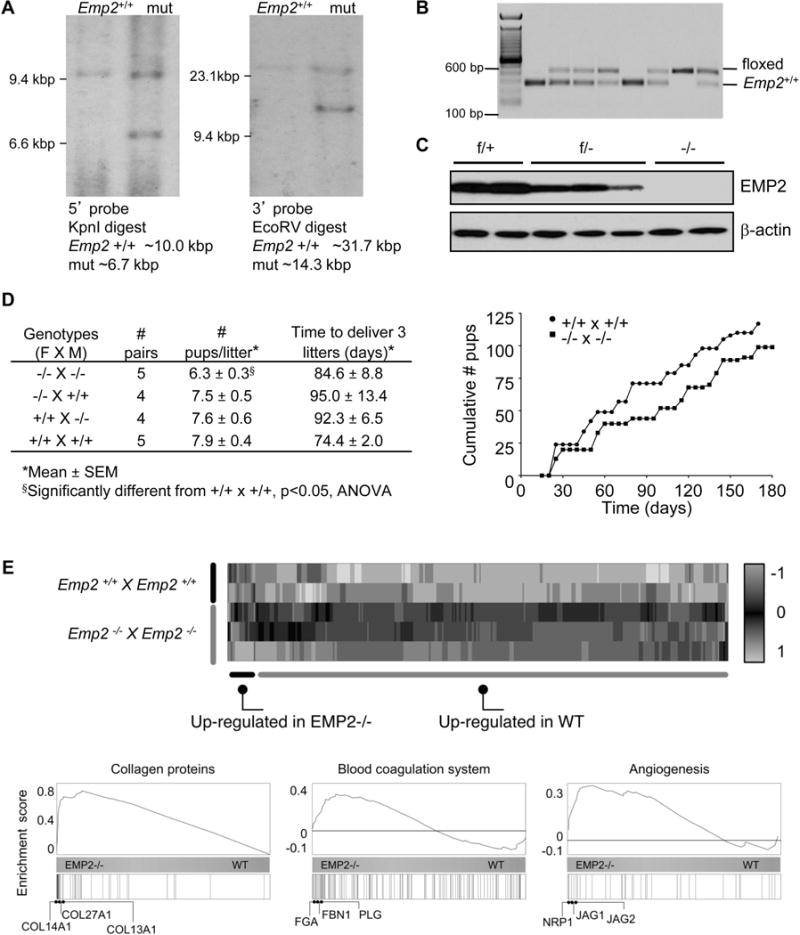
Matings of Emp2−/− × Emp2−/− mice show a reduction in litter size. (A) Recombination strategy used to target the Emp2 gene confirmed by Southern blot. (B) Documentation of germ line transmission. (C) EMP2 protein expression in lung extracts in wild-type, heterozygous, and knock-out mice. (D) Left, Summary of time to deliver 3 litters and size of the litters. Right, the number of pups from Emp2−/− × Emp2−/− and Emp2+/+ × Emp2+/+ mice were enumerated over 180 days. (E) Transcriptomic analysis of implantation sites from Emp2−/− × Emp2−/− and Emp2+/+ × Emp2+/+ mouse crosses is depicted using a heatmap and hierarchical clustering of RNA-Seq expression estimates. Shown are the Z-scores (colormap) for differentially expressed genes across the samples analyzed by RNA-Seq. Bottom, Gene Set Enrichment plots for genes annotated as “Collagens” (left), “Angiogenesis” (middle) and “Coagulation” (right). The horizontal bar in graded color from blue (left) to yellow (right) represents all mouse genes ranked from higher expression in Emp2−/− to higher expression in wild type mice. Vertical black lines represent the ranks of respective genes in each group. The curve in blue corresponds to the calculation of the enrichment score (ES), which in these cases demonstrate a high tendency of those genes to be highly expressed in Emp2−/− crosses as compared to Emp2+/+ crosses.