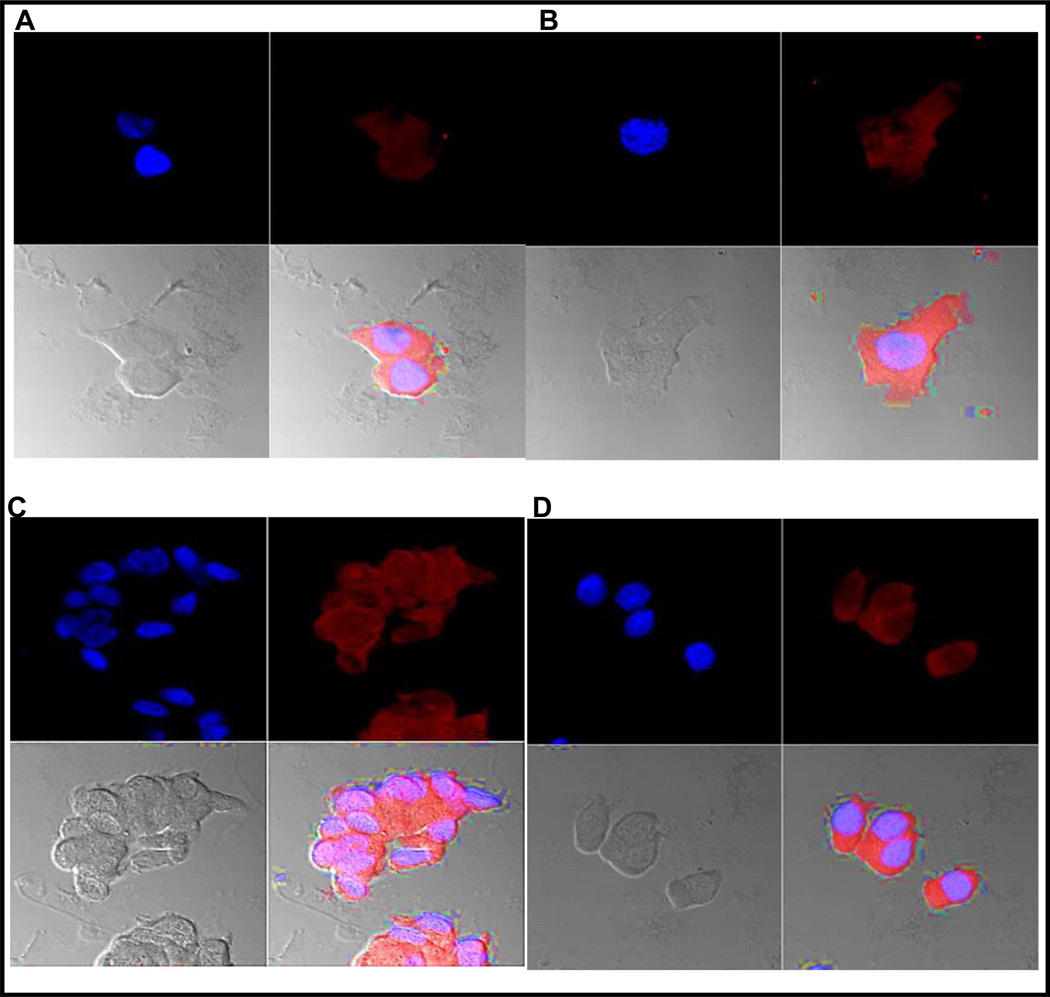
Fig. 1.
Optical imaging of cells prepared from voided urine of patients A, B, C and D. Each image is presented in four subsections. Top left of the four subsections is the cell nucleus in blue, top right is the orange fluorescence of TP4303 bound to VPAC receptors expressed the cell membrane, the lower right is fusion of the two showing the orange fluorescence around the cell, and lower left is cell morphology. Patients A and B had known PCa with Gleason score 3+3 and patients C and D known with PCa had a Gleason score 9.

