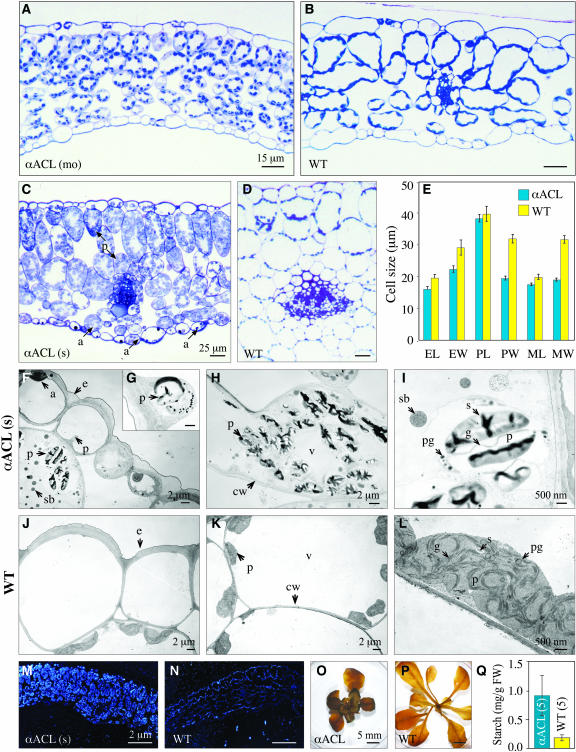
Figure 6.
Reduction in ACL Expression Impedes Cellular Expansion, Alters Cellular Ultrastructure, and Leads to the Hyperaccumulation of Starch.
(A) to (D) Micrographs of midsections of fully expanded leaves from wild-type and antisense-ACLA (αACL) plants; the phenotypic category of each αACL plant is indicated. Four leaves from two independent transgenic lines were examined.
(E) Dimensions (length, L; width, W) of epidermal (E), palisade (P), and spongy mesophyll (M) cells of αACL and wild-type leaves at 26 DAI. For each genotype, dimensions were determined from midleaf cross sections taken from four separate plants. Thirty-two to 214 cells were measured for each category. se is indicated.
(F) to (L) Electron micrographs of cells from leaves of αACL plants with a severe phenotype and wild-type plants at 54 DAI; four leaves from two plants were examined.
(F) and (J) Epidermal cells.
(H), (I), (K), and (L) Mesophyll cells.
(M) and (N) Phase contrast micrographs of Thiery reaction–stained leaf cross sections from αACL and wild-type plants.
(O) and (P) IKI-stained αACL and wild-type seedlings.
(Q) Starch accumulation in αACL and wild-type seedlings. Number of plants analyzed is represented in parentheses.
a, anthocyanin; cw, cell wall; e, epidermis; g, grana; p, plastid; pg, plastoglobuli; s, starch grain; sb, spherical body; v, vacuole.

