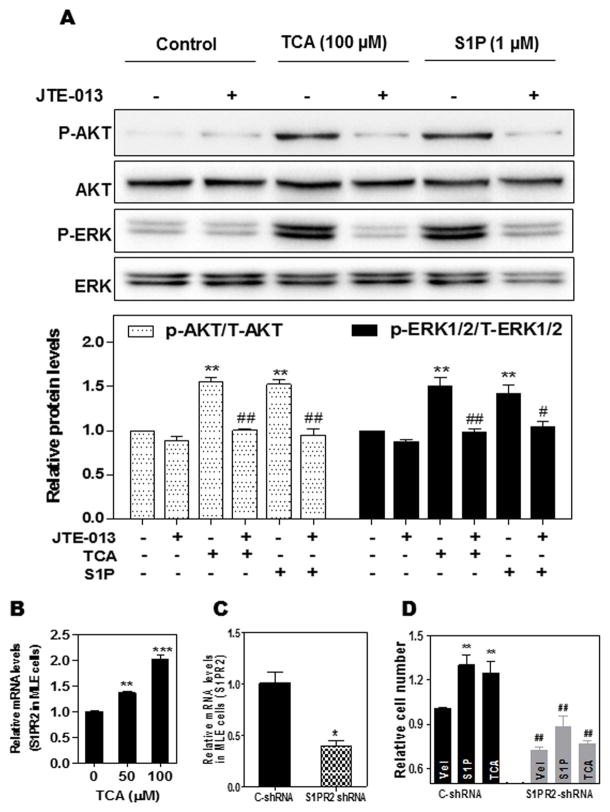
Figure 2. The role of S1PR2 in TCA/S1P-induced AKT and ERK1/2 activation and cholangiocyte proliferation.
(A). MLE were pretreated with JTE-013 (10 μM) for 30 min, then treated with vehicle control (DMSO), TCA (100 μM) or S1P (1 μM) for 30 minutes. The protein levels of phosphorylated AKT (p-AKT), total AKT, p-ERK1/2 and T-ERK1/2 were determined by Western Blot analysis. The representative images of the immunoblots for p-AKT, T-AKT, p-ERK and T-ERK are shown. The relative density of p-ERK/T-ERK and p-AKT/T-AKT were determined by Image J software. **p<0.01, statistical significance relative to control; ##p<0.01, statistical significance relative to the corresponding treatment group with and without JTE-013 (n=3). (B). MLE cells were treated with different amounts of TCA (0, 50, and 100 μM) for 24 h. The mRNA levels of S1PR2 were detected by real-time RT-PCR and normalized with GAPDH as an internal control. The relative amount of S1PR2 mRNA is shown. (C). MLE cells were transduced with purified lentiviral control shRNA (C-shRNA) or S1PR2 shRNA for 48 h. The S1PR2 mRNA was measured by real-time RT-PCR and normalized with GAPDH as an internal control. (D). MLE cells were transduced with lentiviral C-shRNA or S1PR2 shRNA for 36 h, then treated with vehicle control, TCA (100 μM) or S1P (1 μM) for 48 h. Viable cells were analyzed using a Cellometer Vision CBA automatic cell counter. Relative cell number, compared to vehicle control group, is shown. Values represent the mean ± S.E. of three independent experiments. Statistical significance relative to the vehicle control group (designated=1): *p<0.05, **p<0.01, ***p<0.001; Statistical significance relative to the C-shRNA group with the same treatment group, ##p<0.01.

