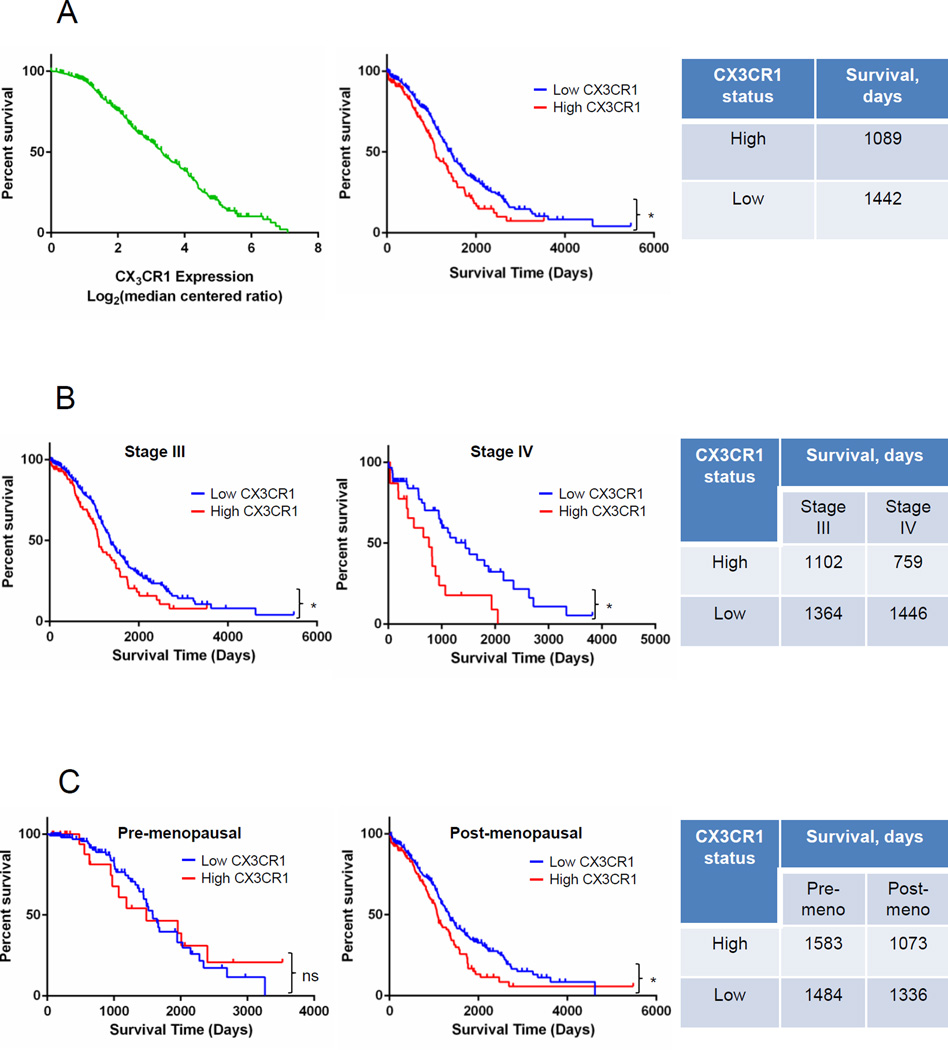
FIGURE 1. High expression of CX3CR1 correlates with an overall shorter survival.
(A) High vs low CX3CR1 expression predicts an overall shorter survival in patients with serous ovarian carcinoma. Data from The Cancer Genome Atlas (TCGA) database for serous ovarian adenocarcinoma were analysed in Oncomine and plotted as CX3CR1 expression Log2(median centered ratio) vs percent survival (green line; left panel). Data points with incomplete information were removed from the analysis; total number of specimens analysed was 557. Based on the value of median CX3CR1 expression, defined as CX3CR1 expression Log2(median centered ratio) at 50% survival, the data set was divided in two (center panel), including specimens with CX3CR1 expression > 3.32, termed “high CX3CR1 expression” (n=143; red line), and specimens with CX3CR1 expression < 3.32, termed “low CX3CR1 expression” (n=414; blue line). Overall survival of patients expressing high and low levels of CX3CR1 was plotted and analysed with Kaplan-Meier plot using Prism software (center panel). Average overall survival of patients with high and low CX3CR1 expression is indicated in the Table (right panel). *p=0.0020, Log-rank (Mantel-Cox) test; *p=0.0027, Gehan-Breslow-Wilcoxon test. (B) High vs low CX3CR1 expression predicts an overall shorter survival in patients with serous ovarian carcinoma at FIGO Stages III and IV. The specimens in groups containing Stage III (n=429) and Stage IV (n=83) specimens were divided in two groups with “high” and “low” CX3CR1 expression (red and blue lines, respectively) corresponding to cases with higher than median CX3CR1 expression and lower than median CX3CR1 expression, respectively (3.23 for Stage III and 3.77 for Stage IV). Overall survival of patients with Stage III disease expressing high (n=100) and low (n=329) levels of CX3CR1 was plotted and analysed with Kaplan-Meier plot using Prism software (left panel); *p=0.0205, Log-rank (Mantel-Cox) test, *p=0.0170, Gehan-Breslow-Wilcoxon test. Overall survival of patients with Stage IV disease expressing high (n=23) and low (n=60) levels of CX3CR1 was plotted and analysed with Kaplan-Meier plot using Prism software (center panel);*p=0.0036, Log-rank (Mantel-Cox) test, *p=0.0197, Gehan-Breslow-Wilcoxon test. Average overall survival of patients at Stage III and IV disease with high and low CX3CR1 expression is indicated in the Table (right panel). (C) High vs low CX3CR1 expression predicts an overall shorter survival in postmenopausal patients with serous ovarian carcinoma. Overall survival of patients of pre-menopausal age with high (n=22) and low (n=108) CX3CR1 expression was plotted and analysed using Kaplan-Meier plots (left panel); p=0.8421, Log-rank (Mantel-Cox) test, p=0.5221, Gehan-Breslow-Wilcoxon test. Overall survival of patients of post-menopausal age with high (n=120) and low (n=307) CX3CR1 expression was plotted and analysed using Kaplan-Meier plots (center panel); *p=0.0046, Log-rank (Mantel-Cox) test, *p=0.0215, Gehan-Breslow-Wilcoxon test. Average overall survival of patients of both pre- and post-menopausal age with high and low CX3CR1 expression is indicated in the Table (right panel).

