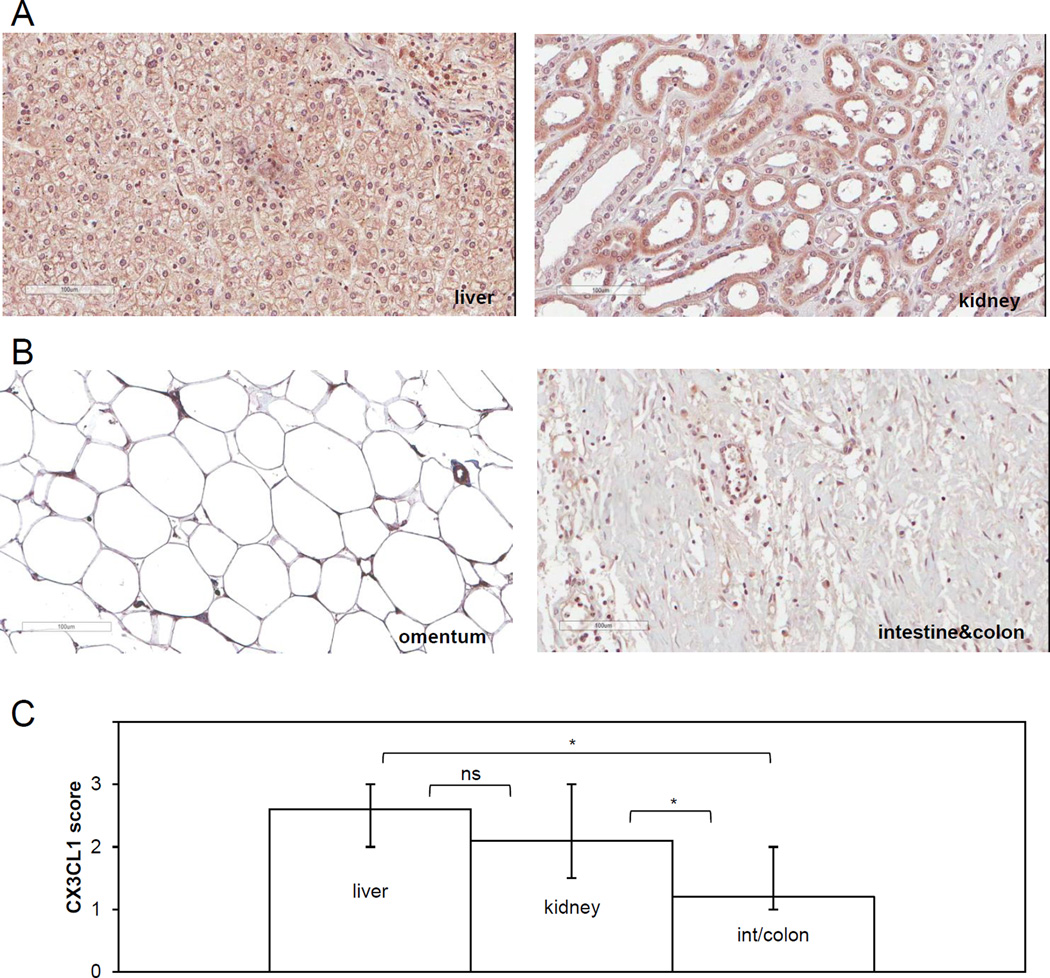
FIGURE 7. Expression of CX3CL1 in human kidney and liver is higher compared to that in intestine/colon and omentum.
Immunohistochemical staining with CX3CL1-specific antibodies was used to determine CX3CL1 expression and intracellular localization in normal human specimens of liver and kidney (A), intestine/colon, and omentum (B). Brown, CX3CL1; blue, hematoxylin. Typical images of CX3CL1-immunoreactive staining in specimens of liver, kidney, intestine/colon, and omentum are shown. Image of liver corresponds to the case C6 (Supplementary Table 3), image of kidney corresponds to the case A4 (Supplementary Table 4), image of intestine/colon corresponds to the case C06 (Supplementary Table 1) and image of normal human specimen of epiploon (greater omentum) belongs to a 21 year old female. Brown, CX3CL1; blue, hematoxylin. Images were generated using Aperio ScanScope; bar, 100 micron. (C) Comparison of the CX3CL1 immunoscores among the tested tissues. The scoring was performed for the entire tissue, including all cell types present (of note, specimens of intestine/colon contained stroma underlying mesothelium, consistent with the microenvironment surrounding ovarian cancer cells anchoring in submesothelial stroma). The normal liver TMA contained 9 female and 15 male specimens; the average staining in female and male samples was 2.6 and 2.4, respectively (Supplementary Table 3). The normal kidney TMA contained 24 female and 56 male specimens; the average staining score in female and male samples was 2.1 and 2.3, respectively (Supplementary Table 4). Distal tubules displayed stronger immunoreactivity against CX3CL1 antibodies compared to the proximal tubules. The visceral peritoneum TMA contained both stomach and intestine/colon specimens. Among those there were 13 female and 14 male intestine/colon specimens with average staining score of 1.2 and 1.0, respectively. Immunoscores of CX3CL1 expression in female specimens of normal human liver, kidney, and intestine/colon were averaged and plotted. The data were analysed using both Mann-Whitney U test and Students’ t-test; * p<0.05.

