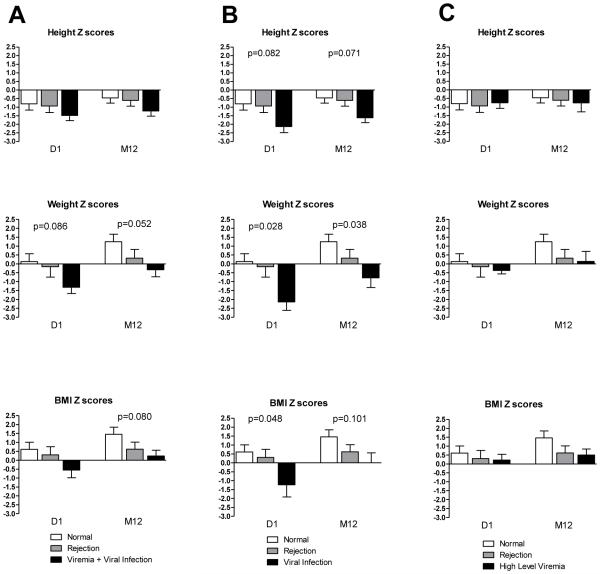
Figure 3. Growth and nutritional Z scores (mean with SE) in pure groups.
Shown are parameters of growth (height/ length) and nutritional status (weight and BMI) for children undergoing kidney transplantation segregated by assignment to pure outcome groups as defined in the Methods. Children without rejection or viremia (Normal; white bar); children experiencing rejection (gray bar); children experiencing viremia + viral infection (column A, black bar), children experiencing viral infection (column B, black bar), children experiencing high level viremia (column C, black bar).

