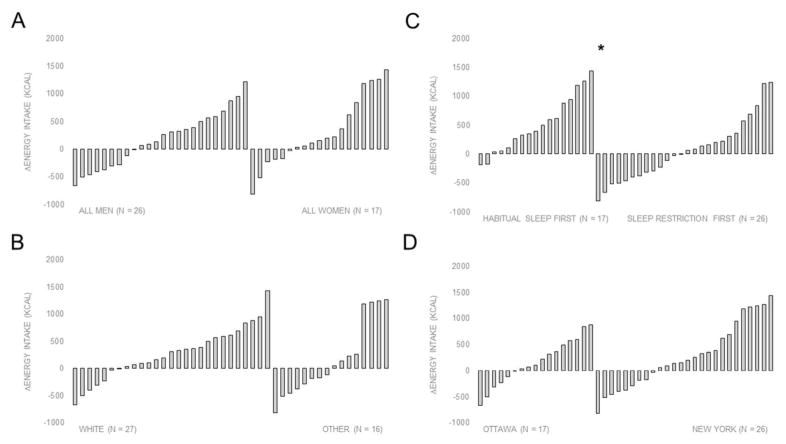
Figure 2.
Distribution of energy intake responses (ΔEI) according to A) sex (man or woman), B) ethnicity (white or other), C) phase order (habitual sleep or sleep restriction conditions first) and D) study site (Ottawa or New York). *P = 0.01
Note: ΔEI for each participant was calculated by subtracting EI during the habitual sleep duration condition to EI during the sleep restriction condition.

