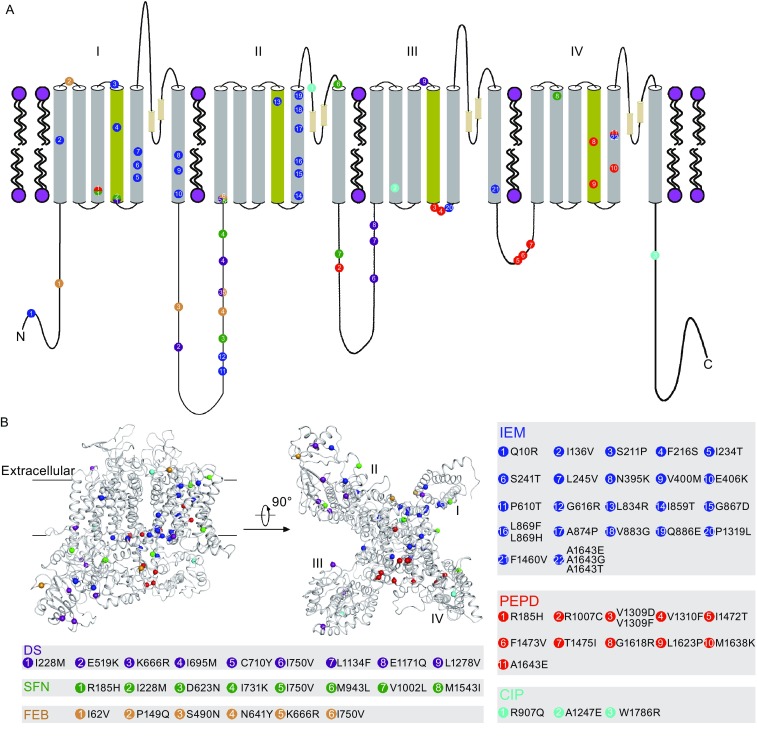
Figure 2.

Amino acid locations of Nav1.7 disease-related mutations on the Nav1.7 structure model. (A) The topology of human Nav1.7 sodium channel. Cylinders represent the transmembrane segments, which are colored in gray except that the S4 voltage-sensing segments are colored in yellow. The lines represent the soluble regions between the transmembrane segments or the N/C-terminus. The two P helices between S5 and S6 segments are shown in cylinders. Mutations of Nav1.7 are discriminately mapped on the topology scheme of Nav1.7 by different colors, namely, IEM (blue), PEPD (red), CIP (cyan), DS (purple), SFN (green), and FEB (pink). (B) Intra-membrane view and intracellular views of the Nav1.7 structure model. Mapping of disease-related mutations onto the Nav1.7 structure model is highlighted by different colors. Summary of Nav1.7 mutations is shown in different gray boxes
