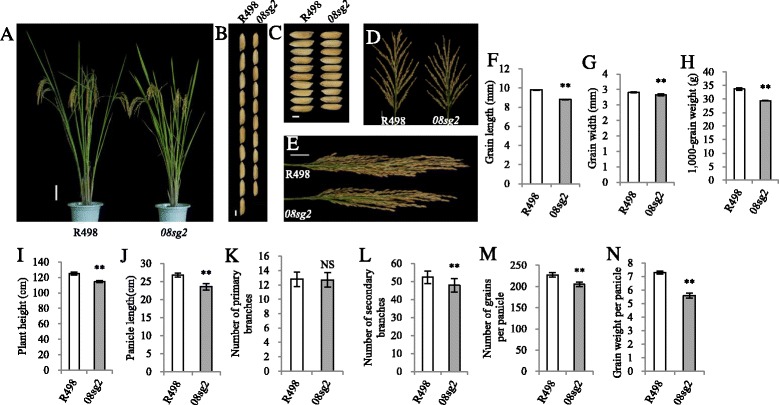
Fig. 1.

Comparisons of phenotype between R498 and 08sg2. a The phenotype of R498 and 08sg2 at reproductive stage. Scale bar, 10 cm. b, c Comparisons of the grain length and grain width between R498 and 08sg2. Scale bar, 3 mm. d, e The panicle morphology of R498 and 08sg2. Scale bar, 3 cm. f Grain length. g Grain width. h 1,000-grain weight. i Plant height. j Panicle length. k Number of primary branches. l Number of secondary branches. m Number of grains per panicle. n Grain weight per panicle. All phenotypic data in F–N were measured from plants grown in paddies under normal cultivation conditions with three-time repeats. Data are given as means ± SD. Student’s t-test was used to generate the P values; ** and NS indicate P < 0.01 and no significant differences, respectively
