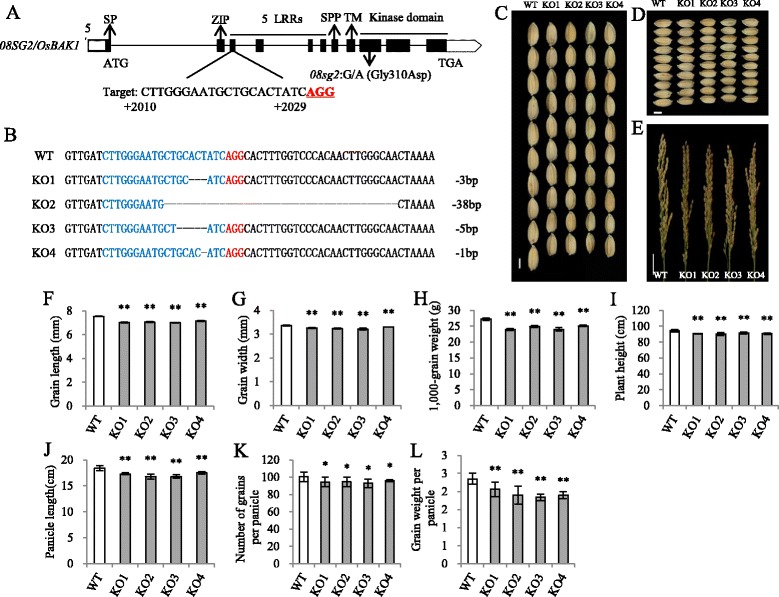
Fig. 3.

Generation of loss of function mutants of OsBAK1 and comparisons of their phenotypes. a Schematic diagram of the target sites in the OsBAK1. The UTRs, exons and introns are indicated by blank rectangles, black rectangles and black lines, respectively. The targeted sites are labeled in black uppercase letters. and the protospacer adjacent motif (PAM) sequences are highlighted in red and underlined. The numbers labeled under the target sequences indicate the distance away from the translation start site (ATG, from 5’to 3’). SP, signal peptide. ZIP, leucine zipper. LRRs, leucine-rich repeats. SPP, pro-rich domain containing the Ser-Pro-Pro (SPP) motif. TM, transmembrane domain. The start codon (ATG) and the stop codon (TGA) are indicated. The 08sg2 mutation in the OsBAK1 was shown. b Sequence alignment of the mutants within the OsBAK1 target in the T1 plants. The wild-type (WT) sequence is depicted at the top with the target sequence in blue and the PAM sequence in red. The deleted sequences are shown by black hyphens, and the number of the deletions are showed on the right. c, d Comparisons of the grain length and grain width between WT and knock out mutants. Scale bar, 3 mm. e The panicle morphology of WT and knock-out mutants. Scale bar, 3 cm. f Grain length. g Grain width. h 1,000-grain weight. i Plant height. j Panicle length. k Number of grains per panicle. l Grain weight per panicle. All phenotypic data in F–L were measured from plants grown in paddies under normal cultivation conditions with three-time repeats. Data are given as means ± SD. Student’s t-test was used to generate the P values; *, ** indicate P < 0.05, P < 0.01, respectively
