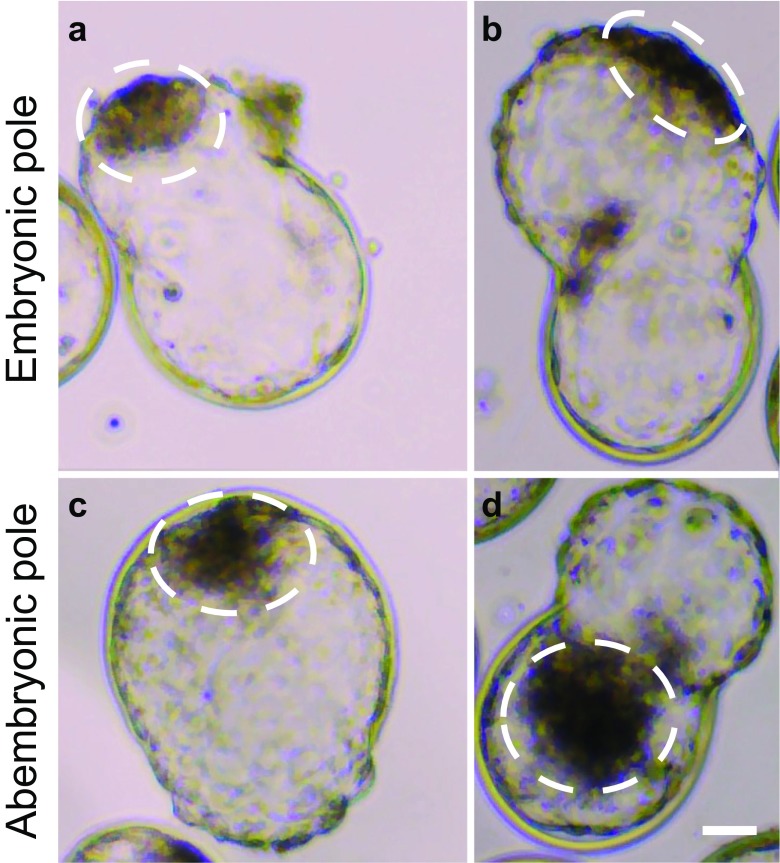
Fig. 1.
Representative images of embryos hatching through the embryonic or abembryonic pole. a, b Embryos escaping the zona pellucida through the embryonic pole. c, d Embryos hatching through the abembryonic pole completely opposite to the ICM (c, d). The area encircled with the dotted line represents the inner cell mass. Scale bar = 50 μM

