Fig. 2.
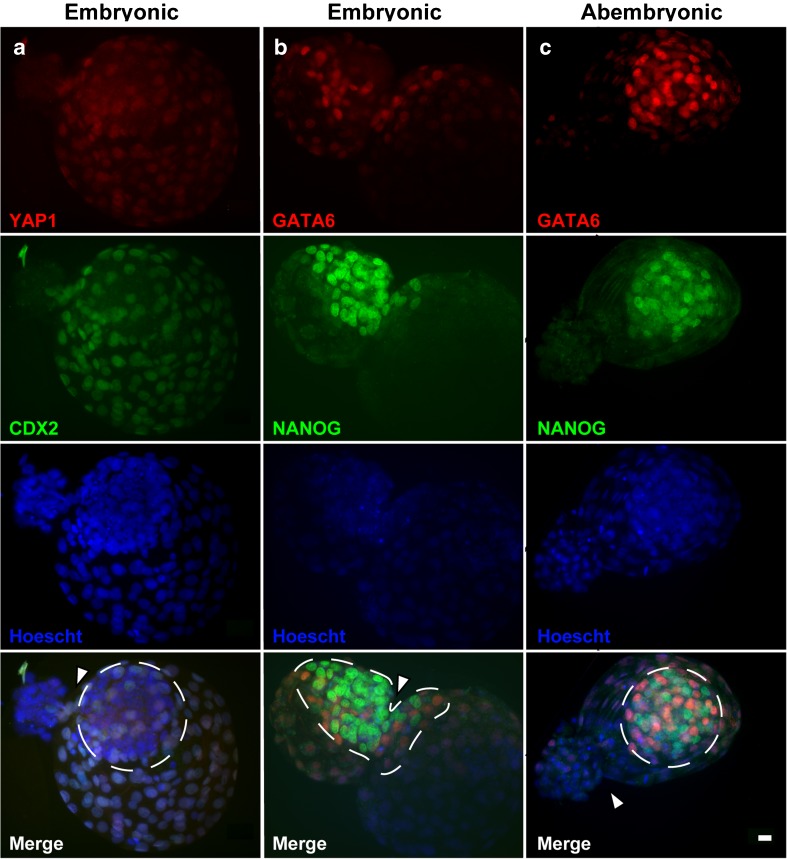
Examples of immunolocalization of inner cell mass (ICM) and trophectoderm (TE) in blastocyst experiencing hatching through the embryonic pole (a, b) and abembryonic pole (c). Immunofluorescence was evaluated using epifluorescence microscopy. a Blastocyst labeled with anti-YAP1 (red) and anti-CDX2 (green). b, c Blastocysts labeled with anti-GATA6 (red) and anti-NANOG (green). Nuclei were labeled with Hoescht 33342 (blue). For each blastocyst, immunofluorescence is shown separately for the red, green, and blue channels. a ICM cells were identified as those were the nuclei were YAP1− and CDX2− while TE cells had nuclei that were YAP1+ and CDX2+. b, c Cells of the ICM that are epiblast are those with nuclei that are NANOG+; cells of the ICM that are hypoblast are those with nuclei that have bright GATA6+. Cells of the TE are those with nuclei that are NANOG− and have dim GATA6+. b Fifty percent of the ICM cells are in the hatched area and 50% remain inside. c The hatched area devoid of NANOG+ and bright GATA6+ nuclei. The area encircled with the dotted line represents the ICM. The white arrowheads indicate the opening through which the embryo is exiting. Scale bar = 20 μM

