
Fig. 6.
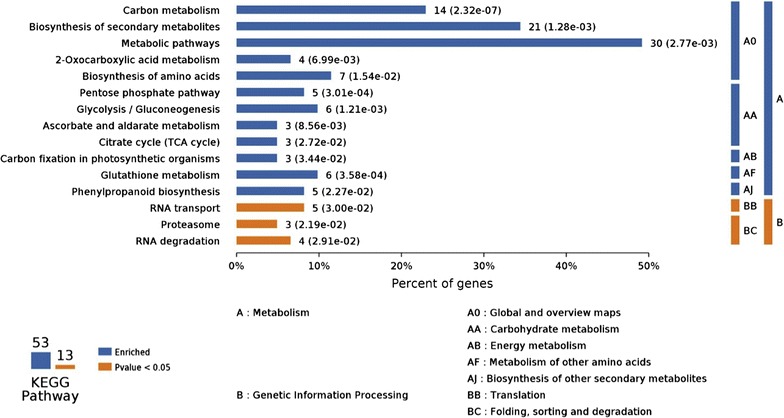
Compared treatment (B-CK) with the control (A-CK), the differentially expressed proteins KEGG pathway enrichment. The number of involved proteins in a specific pathway and corresponding p value are shown on the right side of column
Official websites use .gov
A
.gov website belongs to an official
government organization in the United States.
Secure .gov websites use HTTPS
A lock (
) or https:// means you've safely
connected to the .gov website. Share sensitive
information only on official, secure websites.
Compared treatment (B-CK) with the control (A-CK), the differentially expressed proteins KEGG pathway enrichment. The number of involved proteins in a specific pathway and corresponding p value are shown on the right side of column