
Figure 2.
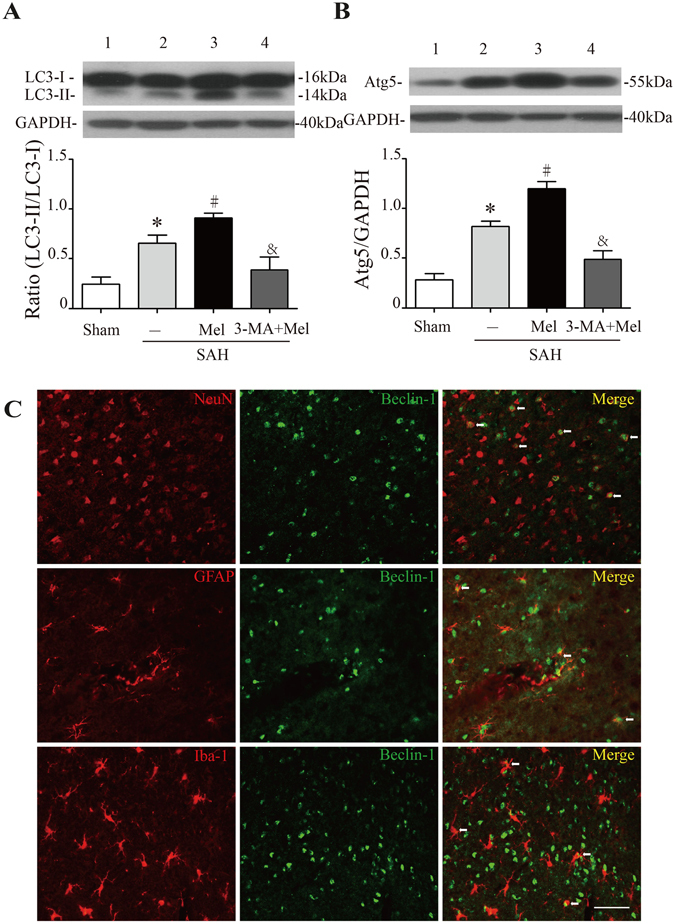
Effect of melatonin treatment on autophagy. (A) The Western blot relative band density of LC3; n = 6 per group. (B) The Western blot relative band density of Atg5; n = 6 per group. The cropped bands had been run under the same experimental conditions. (C) Representative micrographs showing double immunofluorescence labeling of Beclin-1 with NeuN (neuronal marker), GFAP (astrocyte marker) and Iba-1 (microglia marker) in the ipsilateral basal cortex at 24 h after SAH. White arrows indicated double-labeled cells. Scale bar = 50 μm. *P < 0.05 versus sham group, #P < 0.05 versus SAH + vehicle group, and &P < 0.05 versus SAH + Mel group.