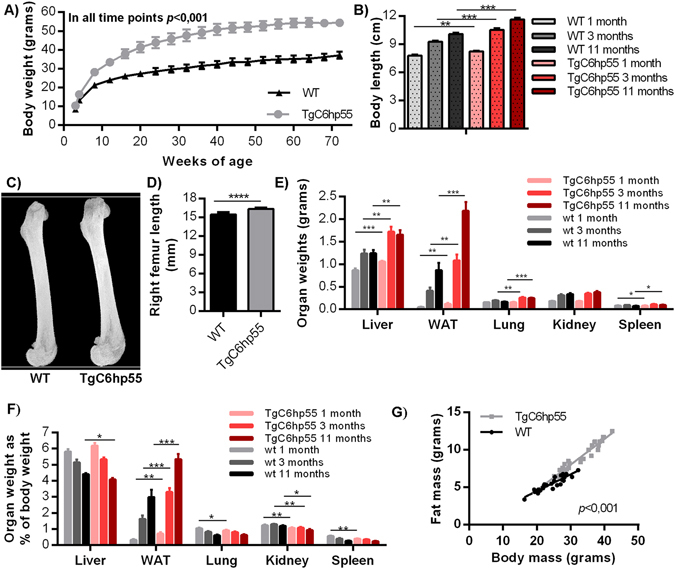
Figure 2.

TgC6hp55 mice show enhanced somatic growth with some additional obesity-like characteristics. (A) Body weight curve performed in wt (n = 10) and TgC6hp55 (n = 10) mice coming from Founder 1 from the age of 3 weeks till the age of 72 weeks. (B) Comparison of the body length of wt and TgC6hp55 mice at the age of 1, 3 and 11 months. As body length we measured the distance from the tip of the mouse nose to the base of its tail. At 1 month n = 10 wt and n = 10 TgC6hp55 mice were compared, while at 3 months n = 8 wt and n = 8 TgC6hp55 and at 11 months n = 7 wt and n = 9 TgC6hp55. (C) Comparison of the right femur length of wt (n = 7) and TgC6hp55 (n = 6) mice at the age of 3 months using microCT analysis. (D) Quantification of the microCT analysis data presented in (C). (E) Comparison of liver, abdominal white adipose tissue (WAT), lung (both lungs), kidney (both kidneys) and spleen weight of the wt and TgC6hp55 mice shown in (B) at the age of 1, 3 and 11 months. (F) Comparison of the normalized organ weights from (E) expressed as % of the mouse body weight at the age of 1, 3 and 11 months. (G) Linear regression analysis of the fat tissue mass in correlation with body mass in wt (n = 30) and TgC6hp55 (n = 29) at the age of 13 weeks. Data represent mean ± SEM.
