
Figure 3.
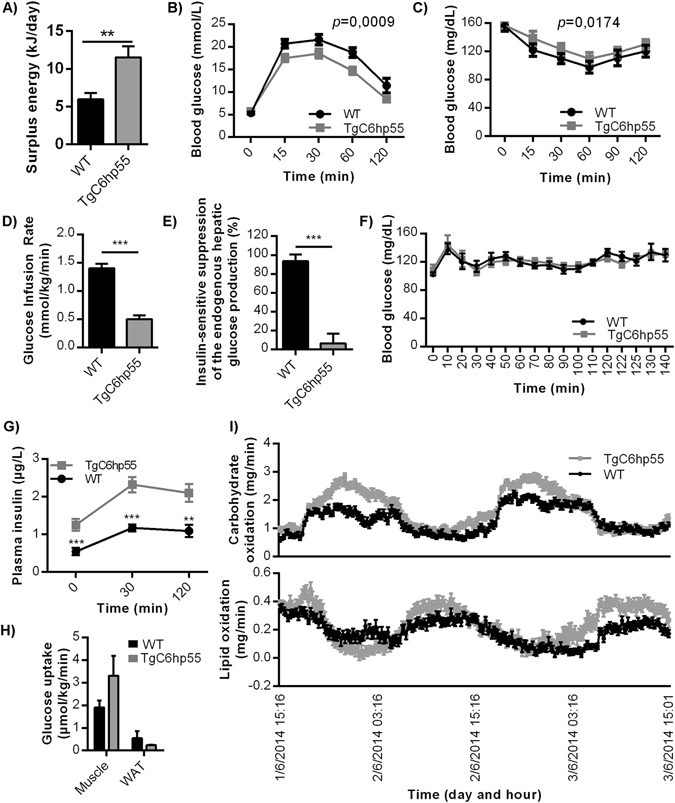
TgC6hp55 mice show increased energy surplus and are normoglycemic despite perturbed insulin sensitivity. (A) Comparison of the daily energy surplus between wt and TgC6hp55 mice (n = 15 wt and 11 TgC6hp55). (B) Intraperitoneal Glucose Tolerance Test (ipGTT) performed in wt (n = 16) and TgC6hp55 (n = 13) mice. p value represents the comparison between the Area Under the Curve for the wt versus TgC6hp55 mice. (C) Intraperitoneal Insulin Tolerance Test (ipITT) performed in wt (n = 16) and TgC6hp55 (n = 13) mice. p value represents the comparison between the Area Under the Curve for the wt versus TgC6hp55 mice. (D) Comparison of the Glucose Infusion Rate needed in order to retain euglycemia in the mice during the hyperinsulinemic-euglycemic clamp (n = 7 wt and 6 TgC6hp55 mice). (E) Comparison of the Insulin-Sensitive Suppression of the Endogenous Hepatic Glucose Production during the hyperinsulinemic-euglycemic clamp in n = 8 wt and n = 7 TgC6hp55 mice. (F) Blood glucose levels during the basal period of the hyperinsulinemic-euglycemic clamp. (G) Measurement of the Glucose Stimulated Insulin Secretion during the ipGTT shown in Fig. 3C. (H) Comparison of the glucose uptake from the skeletal muscle (gastrocnemius muscle) and from the white adipose tissue (epididymal white adipose tissue) in wt (n = 6) and TgC6hp55 (n = 6) mice. (I) Comparison of the carbohydrate and lipid oxidation during a 2-days calorimetry in n = 16 wt and n = 15 TgC6hp55 mice. Only the differences observed in the carbohydrate oxidation were statistically significant.