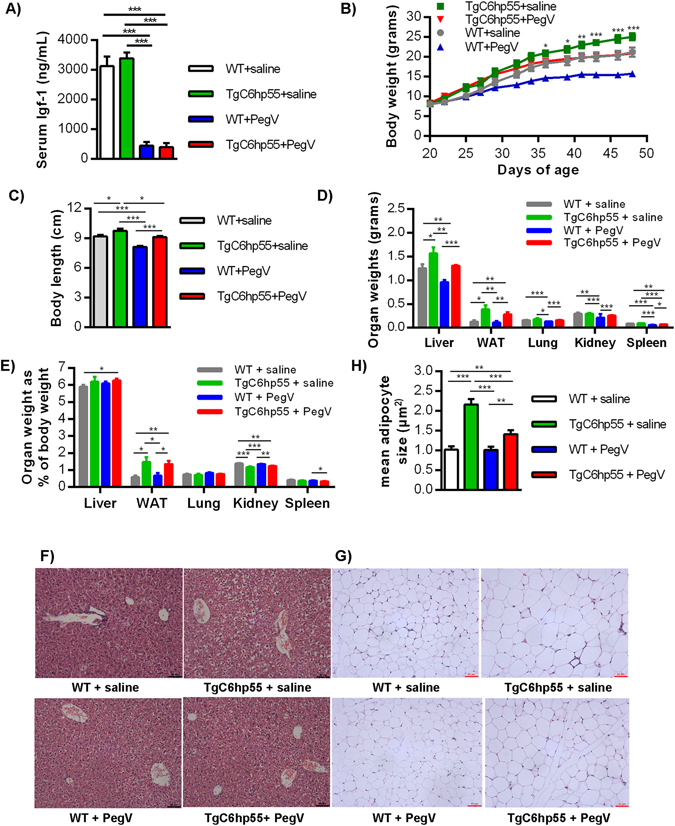
Figure 7.

Pharmacological inhibition of the GH signaling reverses most of the TgC6hp55 phenotypic characteristics. 4 groups of mice: 8 wt received saline, 8 wt received pegvisomant (PegV), 8 TgC6hp55 received saline and 8 TgC6hp55 received PegV. (A) Serum levels of Igf-1 in all 4 groups. (B) Body weight curve. *Represent comparison between TgC6hp55+saline versus TgC6hp55+PegV. (C) Body length comparison. (D) Comparison of liver, abdominal white adipose tissue (WAT), lung (both lungs), kidney (both kidneys) and spleen weight among 4 groups. (E) Comparison of the normalized organ weights from (7D) expressed as % of the mouse body weight. (F) Histopathological assessment of the lipid accumulation in the livers of all 4 groups (H/E staining). (G) Histopathological comparison of the adipocyte size from the abdominal white adipose tissue of all 4 groups (H/E staining). (H) Quantification of the adipocyte size shown in Fig. 7F. (F) and (G) are in 200x magnification/scale = 60 μm. Data represent mean ± SEM.
