
Figure 4.
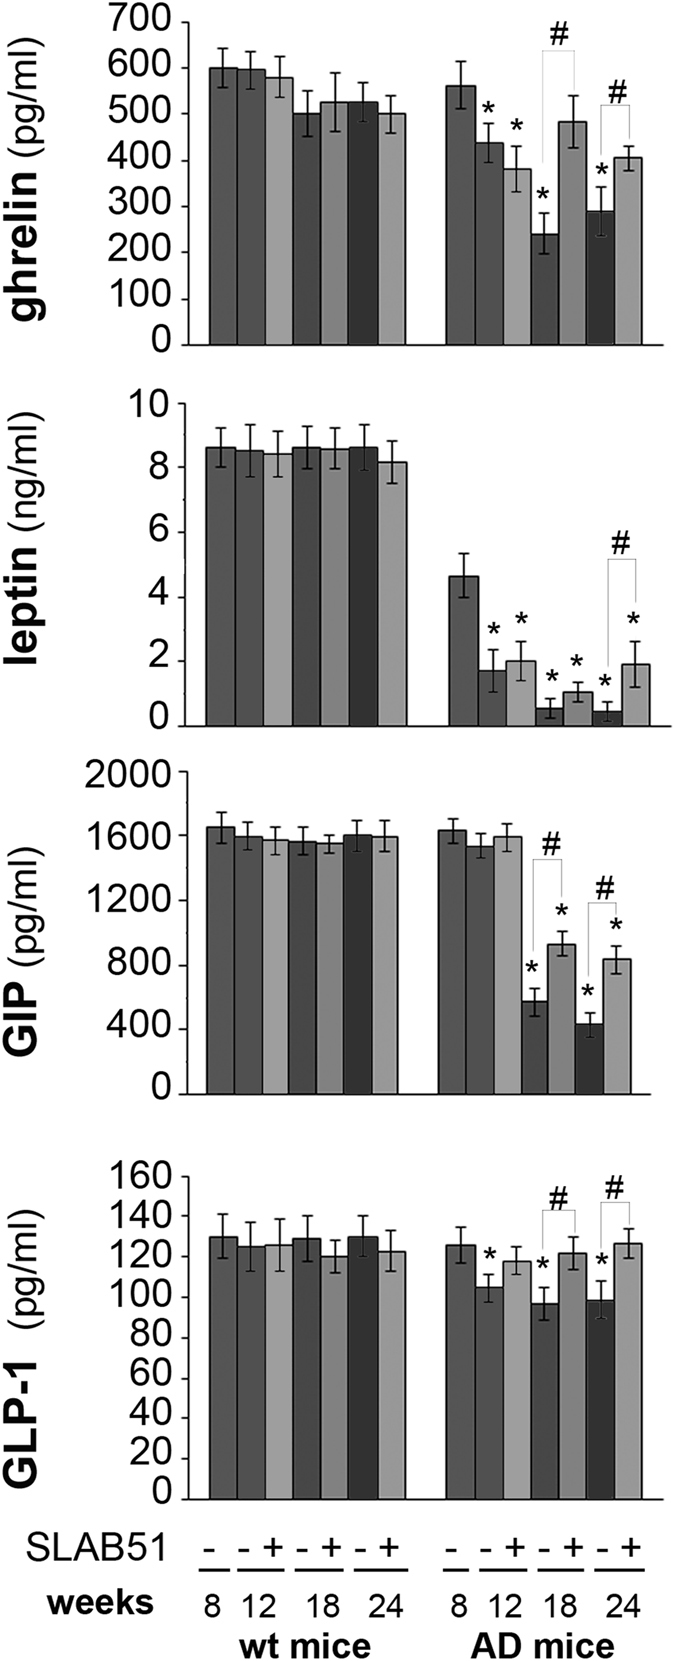
Plasma concentrations of gut hormones. Hormones were determined in the plasma of treated and control wt and AD mice. Results are expressed as percentage with respect to 8 week-old untreated mice. Data points marked with an asterisk are statistically significant compared to 8 week-old untreated control mice (*p < 0.05). Data points marked with hash are statistically significant compared to their respective control mice in the same time point (#p < 0.05).