
Figure 8.
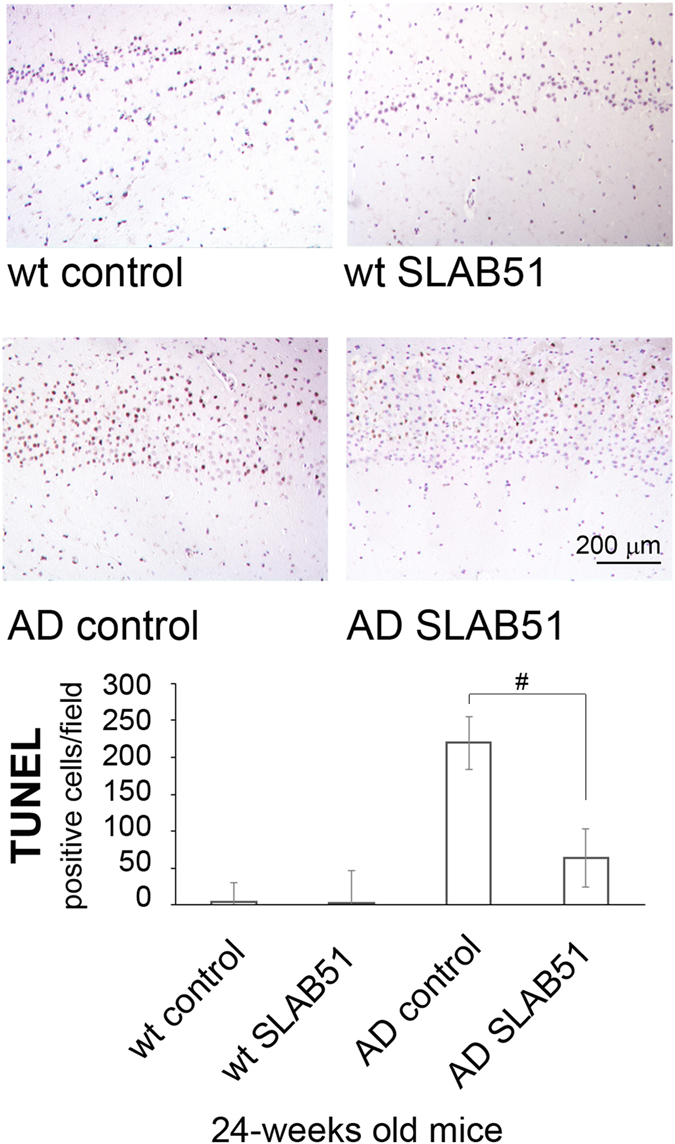
TUNEL detection of apoptotic neurons in hippocampal area of SLAB51 treated and untreated AD and wt mice. Apoptotic cells are characterized by black-brownish nuclear stain, as shown in the representative images. (TUNEL (DeadEnd, Promega®) reaction, with Meyer’s hematoxylin nuclear counterstain. Bar = 200 μm.). The histogram shows the TUNEL positive cells/field. Data are representative of 5 histological section for each brain (n = 8 per sub-group). Data points marked with a hash are statistically significant compared to their respective water-treated mice (p < 0.05).