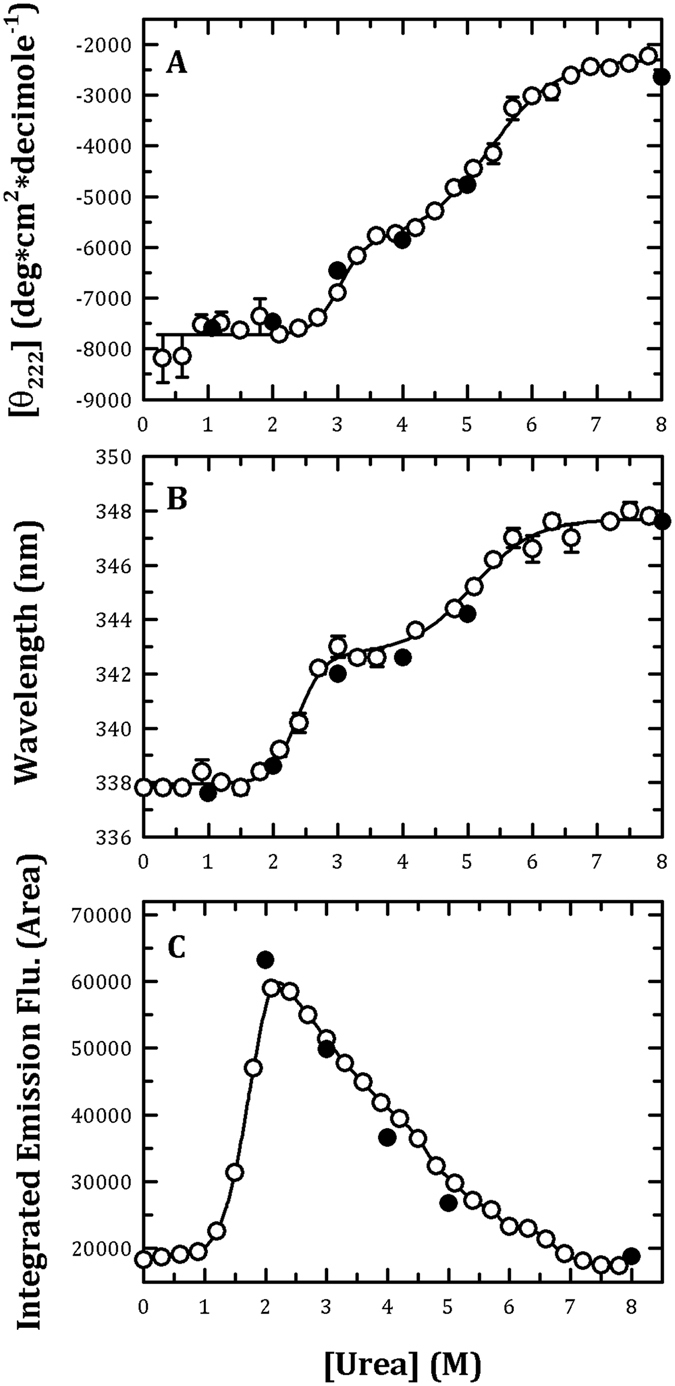
Figure 2.

Monitoring of the urea-induced unfolding and refolding of human PAD4 WT enzyme by CD spectrometry and the intrinsic protein fluorescence. The PAD4 WT enzyme in the presence of 10 mM Ca2+ was treated with various concentrations of urea in 50 mM Tris-HCl buffer (pH 7.4) at 25 °C for 16 h and then monitored through CD spectrometry (A), fluorescence (B) or ANS fluorescence (C). Open circles: the PAD4 enzyme was denatured with different concentrations of urea. Closed circles: the PAD4 enzyme was completely denatured with 8 M urea and then renatured by diluting the urea concentration to 5, 4, 3, 2 and 1 M, as indicated in the figures. The experimental data in (A,B) were fitted by either a two-state or three-state model. The fit results and residues are shown as a solid line with error bars.
