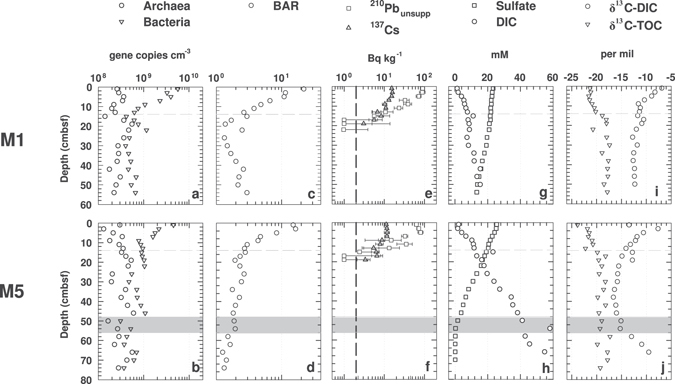
Figure 2.

Fine-scale microbial abundance and geochemical profiles of surface sediments at M1 (M1-RL, top row of panels) and M5 (M5-RL, bottom row of panels). (a,b), abundances of archaeal and bacterial 16S genes; (c,d), BARs; (e,f) mean 210Pbunsupp and 137Cs values ± standard deviation (SD) - the detection limit of 210Pbunsupp and 137Cs is indicated by the dashed black line; (g,h), concentrations of sulfate and DIC; (i,j), δ13C-DIC and -TOC. The horizontal grey dashed lines indicate 0.14 mbsf, which is the minimum depth of macrofaunal sediment reworking based on 210Pbunsupp. The shaded grey area at M5 marks the interval of the SMTZ.
