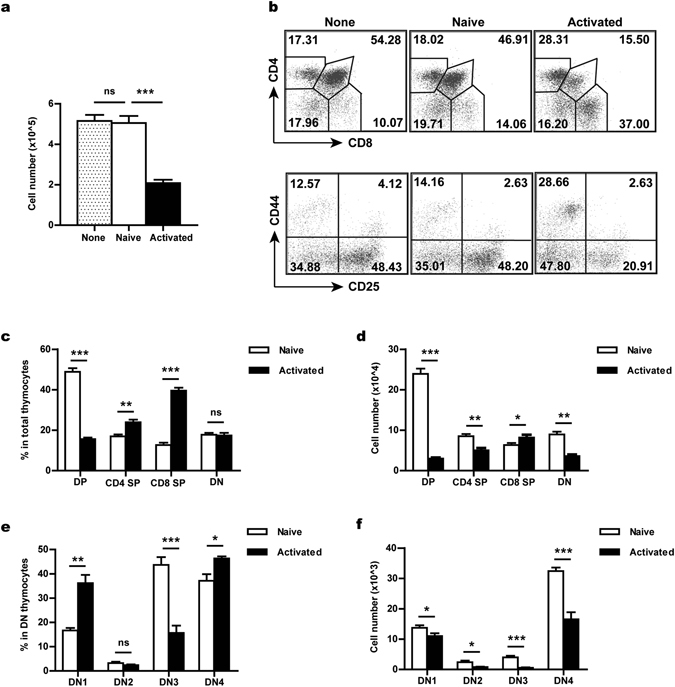
Figure 1.

T cell developmental defects in the activated CD4+ T cell-treated FTOC. Fetal thymic organ cultures were set up with d16 fetal thymuses (CD45.2+) pre-incubated without or with 2 × 10⁴ naive or activated CD4+ T cells (CD45.1+). The cultures were harvested and analysed at day 12. (a) The total number of thymocytes recovered from a single thymic lobe under different culture conditions. (b) Flow cytometric analysis of T cell development in FTOCs. Dot plots show representative profiles for CD4/CD8 staining (gated on CD45.2+ cells) and for CD25/CD44 staining (gated on CD45.2+ CD4− CD8− DN cells). (c,d) The percentage (c) and absolute number (d) of DN, DP, CD4 SP and CD8 SP thymocytes in naive or activated T cell-treated cultures. (e,f) The percentage (e) and absolute number (f) of different subsets of DN thymocytes in naive or activated T cell-treated cultures. DN1, CD25− CD44+; DN2, CD25+ CD44+; DN3, CD25+ CD44−; and DN4, CD25− CD44−. The experiments were repeated at least six times with 3- 5 thymic lobes for each group in each experiment. Data are presented as Mean ± SEM. *p < 0.05; **p < 0.01; ***p < 0.001; and ns, not significant.
