
Figure 2.
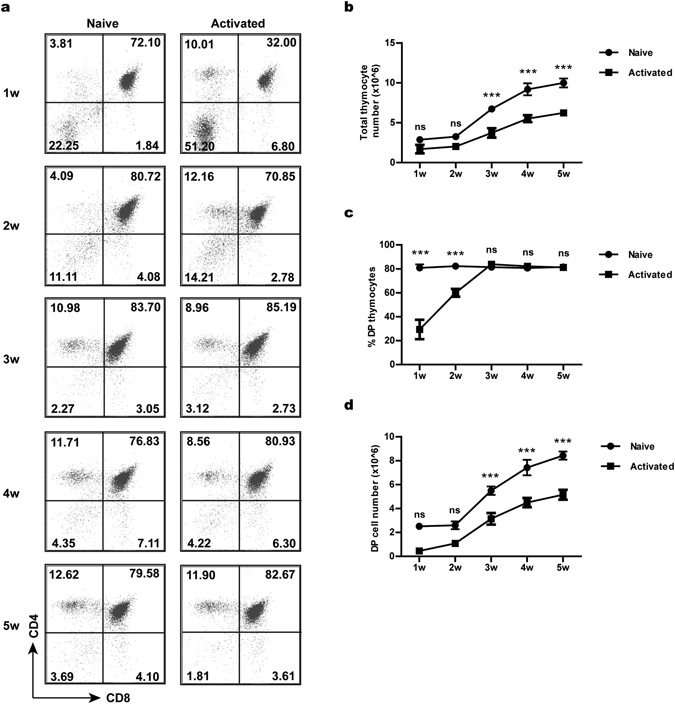
The impaired capacity of activated T cell-treated fetal thymuses to support T cell development in vivo. Fetal thymuses (CD45.2+) were first mixed with naive or activated T cells in hanging drops for 24 hours and then cultured in FTOC for 12 days before being implanted under the kidney capsules of CD45.1+ mice. The development of host T cells in the implants was analysed by flow cytometry. (a) Representative CD4/CD8 staining profiles of CD45.1+ host-derived thymocytes at different time points after transplantation. The number indicates the percentage of cells in each quadrant. (b) Cell counts of host-derived thymocytes. (c) The percentage of DP thymocytes. (d) The absolute number of DP thymocytes. The experiments were repeated three times with at least 5 mice for each experiment. Data are presented as Mean ± SEM. *p < 0.05; **p < 0.01; ***p < 0.001; and ns, not significant. In addition to the point-to-point comparisons shown in the figure, two-way Anova analysis was performed to determine the statistical significance of the differences between the two groups over the time course in terms of total thymocyte number (p < 0.0001), percentage of DP thymocytes (p < 0.0001) and absolute number of DP thymocytes (p < 0.0001).