Figure 3.

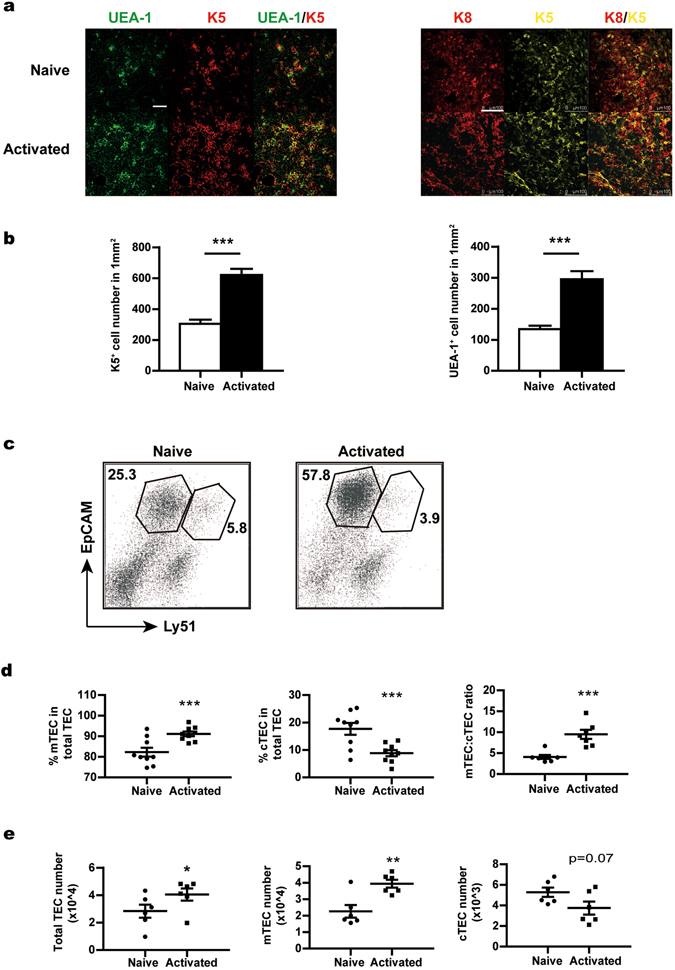
The distorted composition of thymic epithelial cells in the activated T cell-treated fetal thymus. Fetal thymuses were cultured in the presence of naive or activated CD4+ T cells and analysed at day 12. (a) Thymic lobes were examined by confocal microscopy to detect the expression of keratin 5 (K5) and keratin 8 (K8) and the binding activity for UEA-1. Representative images from three independent experiments are shown. Scale bars: 75 μm for UEA-1 and K5 staining; 100 μm for K8 and K5 staining. (b) The numbers of K5+ (left) and UEA-1+ (right) cells were counted in 10 randomly chosen sections of 370 × 370 μm2 and then converted into cell number per mm2. Data from three independent experiments are presented as Mean ± SEM. (c) Single cell suspension of thymic cells was prepared. MACS-enriched CD45− stromal cells were stained with antibodies against CD45, EpCam and Ly51. Representative dot plots are shown with gates for mTECs (CD45− EpCam+ Ly51−) and cTECs (CD45− EpCam+ Ly51+). (d) The percentage of mTECs (left) and cTECs (middle) in total TECs and the ratio of mTECs versus cTECs (right). (e) The absolute number of total TECs (left), mTECs (middle) and cTECs (right). The experiments were repeated 6–9 times. Each experiment included 20–30 fetal thymic lobes for each group, which were then pooled for analysis. Each dot represents the result from a single experiment. Data are presented as Mean ± SEM. *p < 0.05, **p < 0.01; ***p < 0.001; and ns, not significant.
