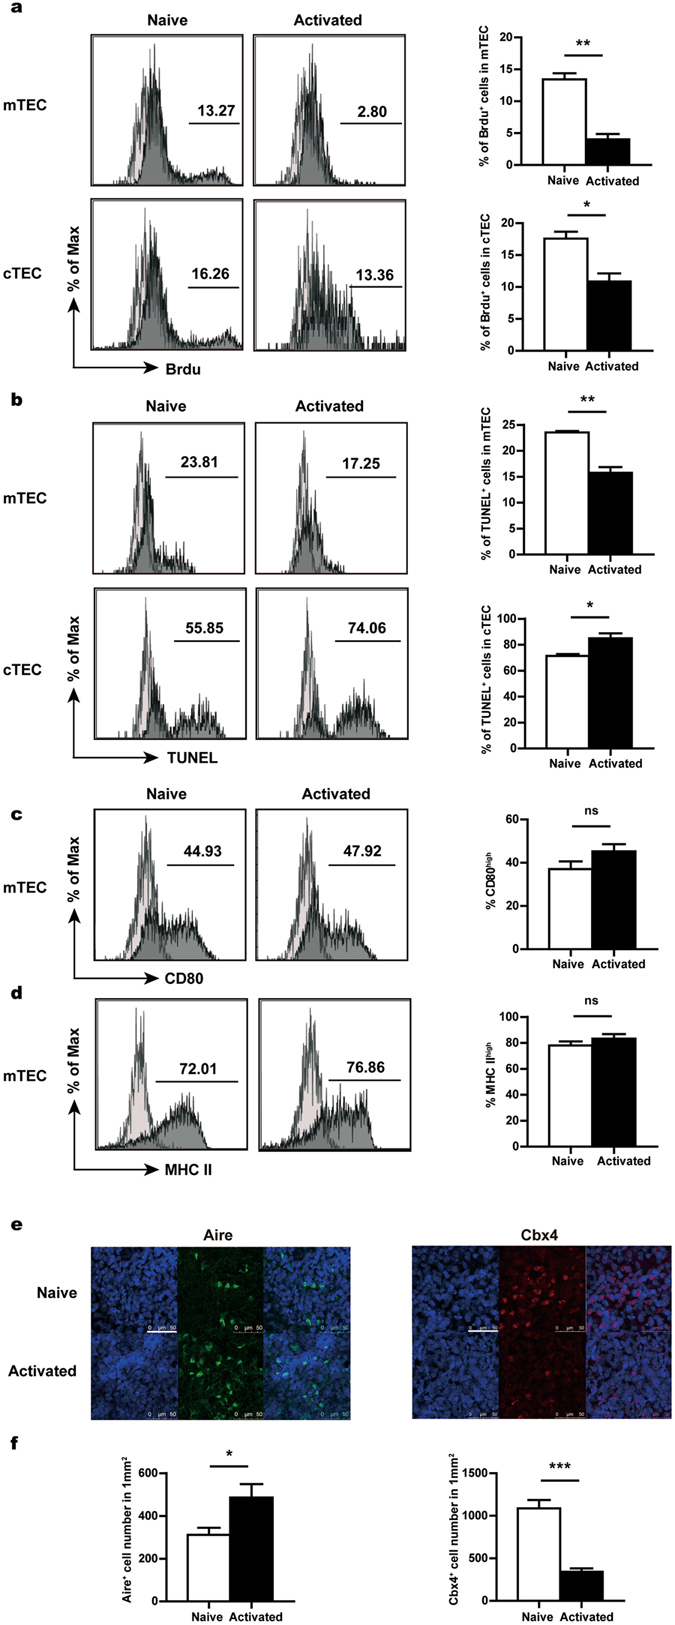
Figure 4.

Inhibited TEC proliferation but enhanced mTEC production in the activated T cell-treated fetal thymus. Fetal thymuses were co-cultured with naive or activated CD4+ T cells for 12 days. mTECs were gated on CD45− EpCam+ Ly51− cells and cTECs were gated on CD45− EpCam+ Ly51+ cells in flow cytometric analysis. (a) Brdu was added to the culture 24 hours before harvesting. Brdu incorporation was detected by flow cytometry. Representative histograms (left) and the percentage of Brdu+ cells (right) are shown for mTECs (upper) and cTECs (lower), respectively. (b) TUNEL assay was performed to evaluate the apoptosis of mTECs (upper) and cTECs (lower). Representative histograms (left) and the percentage of TUNEL+ cells (right) are shown. (c) The expression of CD80 in mTECs was measured by flow cytometry. Representative histograms (left) and the percentage of CD80high cells (right) are shown. (d) Representative histograms of MHCII staining (left) and the percentage of MHCIIhigh cells (right) in mTECs. Shallow shades represent the staining controls for different markers. (e) Immunofluorescent staining was performed to detect the expression of Aire and Cbx4. Co-staining was performed with Hoechst 33342. Scale bars: 50 μm. Similar results were obtained from three independent experiments. Representative images are shown. (f) The number of Aire+ (left) and Cbx4+ (right) cells were counted in 10 randomly chosen sections of 145 × 145 μm2 and then converted into cell number per mm2. Data from three independent experiments are presented as Mean ± SEM. *p < 0.05; **p < 0.01; p < 0.001; and ns, not significant.
