Figure 5.

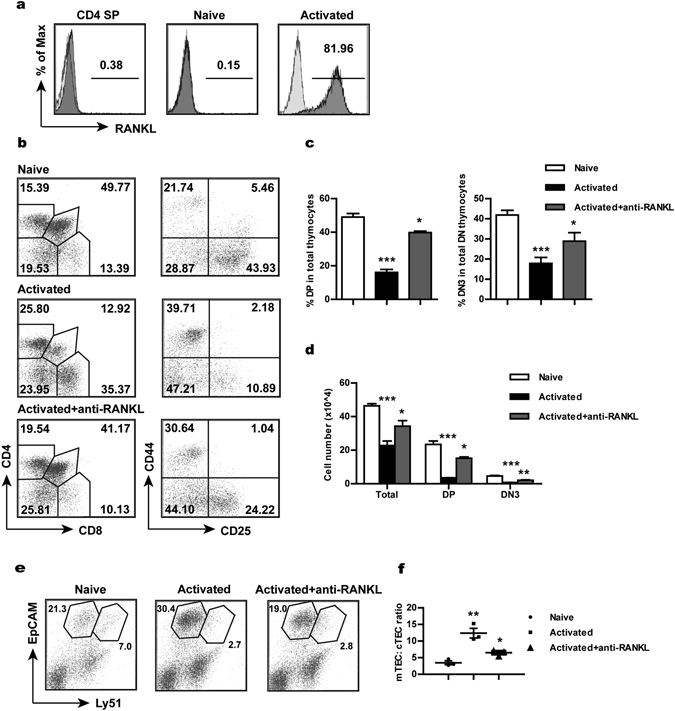
Implication of RANK signaling in activated CD4+ T cell-induced effects. (a) The expression level of RANKL measured by flow cytometry in CD4 SP thymocytes, naive CD4+ T cells and anti-CD3/CD28-activated CD4+ T cells. Shallow shades represent the staining controls. (b) Fetal thymuses were co-cultured with activated T cells with or without the addition of neutralising antibodies against RANKL and analysed at day 12. Dot plots show representative profiles for CD4/CD8 staining (gated on CD45.2+ cells) of total thymocytes and for CD25/CD44 staining (gated on CD45.2+ CD4− CD8− DN cells) of DN cells. The number indicates the percentage of cells within the gate. (c,d) The percentage of DP and DN3 cells (c) and the absolute number of total, DP and DN3 thymocytes (d) in FTOCs under different conditions. (e,f) Flow cytrometric analysis of EpCam and Ly51 expression by MACS-enriched CD45− thymic stromal cells (gated on CD45− cells). Representative dot plots (e) and the ratio of mTECs versus cTECs (f) are shown. The experiments were repeated three times. Each experiment included 20–30 fetal thymic lobes for each group, which were then pooled for analysis. Each dot represents the result from a single experiment. Data are presented as Mean ± SEM. *p < 0.05, **p < 0.01; ***p < 0.001.
