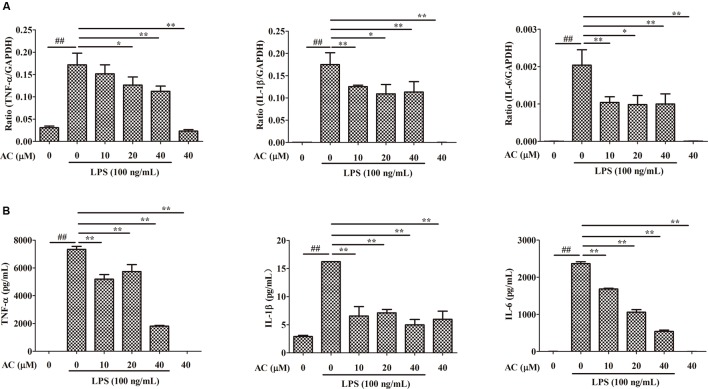
FIGURE 7.
Inhibitory effects of AC on (A) mRNA expression and (B) secretion of TNF-α, IL-1β, and IL-6 in LPS-induced RAW 264.7 cells. Data were obtained from three independent experiments and are expressed as the mean ± SD. #P < 0.05, ##P < 0.01 for the LPS-treated group vs. the normal control group; ∗P < 0.05, ∗∗P < 0.01 for the treatment groups vs. the LPS-treated group.

