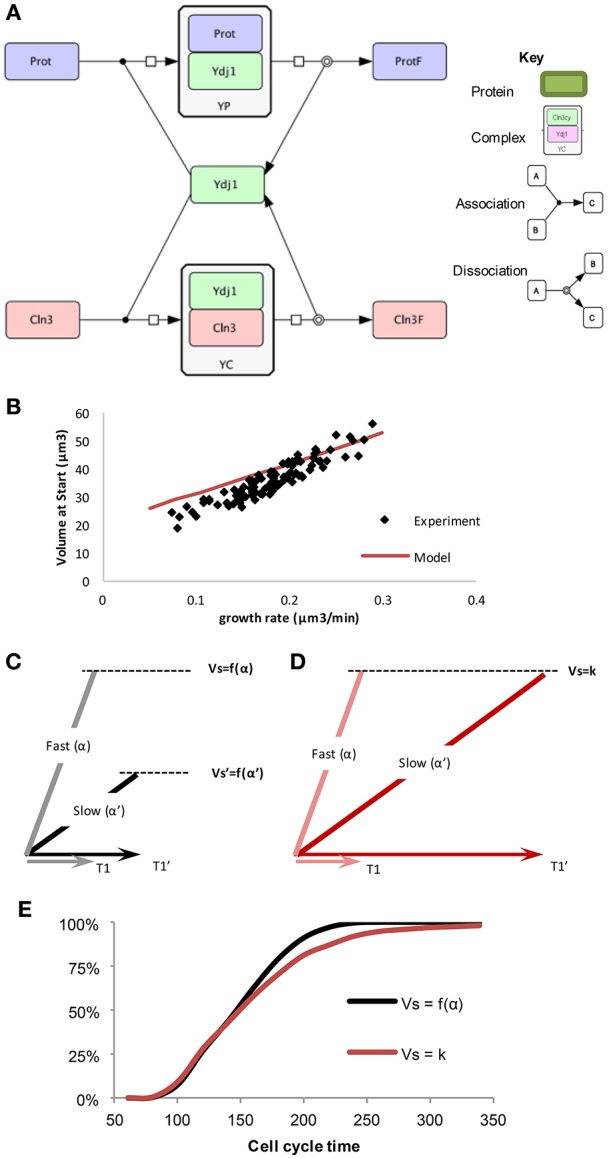
Figure 2.

The “speedometer” model of cell growth rate—critical cell size coupling. (A) Competition between prot and Cln3 for free Ydj1, drawn in CellDesigner (http://www.celldesigner.org/). (B) The “speedometer” model qualitatively predicts cell size as a function of growth rate. Experimental data as in Figure 1C. (C,D) Length of G1 (T1) have a larger noise and slow growing cells have much longer G1 in the model with fixed critical size, compared to G1 length in a growth rate dependent critical size model. (E) Cumulative distribution of cells finishing the cell cycle starting from a population of random newborn daughter cells in the two sizer models (Ferrezuelo et al., 2012).
