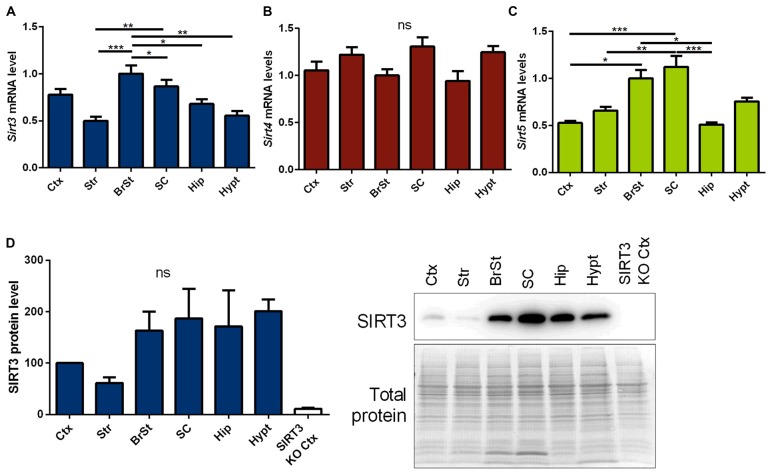
Figure 1.
Distribution of mitochondrial sirtuins in different regions of the murine central nervous system (CNS). Cortex (Ctx), striatum (Str), brain stem (BrSt), spinal cord (SC), hippocampus (Hip) and hypothalamus (hypt) of 60 day old B6SJL mice were compared according to their sirtuin 3 (Sirt3) (A), sirtuin 4 (Sirt4) (B) and sirtuin 5 (Sirt5) (C) mRNA levels. mRNA levels were quantified by quantitative real-time PCR (qPCR) and normalized to TATA box binding protein (Tbp) and RNA polymerase 2 (Polr2a). Data are shown relative to BrSt levels (n = 5–6). One-way ANOVA was used for statistical analysis followed by Tukey’s multiple comparison test. (D) The tissue comparison was performed on SIRT3 protein level as well using 100 day old B6SJL mice, including cortex of SIRT3 knock-out (KO; 129-Sirt3tm1.1Fwa/J) mice (n = 3–6). Protein levels were normalized to total protein amount determined by MemCode staining. The nonparametric Kruskal-Wallis test was used followed by Dunn’s correction. Data are presented as mean ± SEM.ns = P > 0.05, *P ≤ 0.05, **P ≤ 0.01, ***P ≤ 0.001.

