
Figure 6.
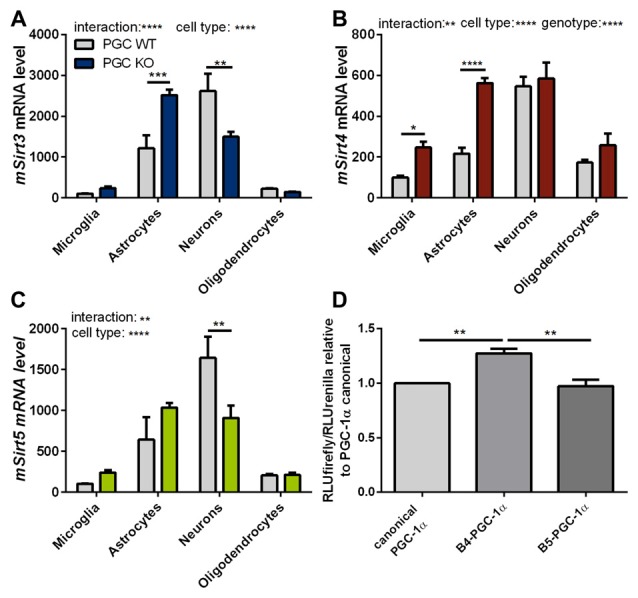
PGC-1α isoforms influence Sirt3 mRNA levels cell type specifically. Primary microglia, astrocytes, neurons and oligodendrocytes were cultured from B6.129-Ppargc1atm1Brsp/J (PGC-1α KO) mice. Sirt3 (A), Sirt4 (B) and Sirt5 (C) mRNA levels were determined by qPCR and normalized to TATA box binding protein (Tbp), RNA polymerase 2 (Polr2a). The mRNA levels are shown relative to wt microglia cells. Data was analyzed by two-way ANOVA, followed by Sidak’s multiple comparison test with n = 4–6. The DualGlo luciferase assay (Promega) was used to determine the PGC-1α mediated activation of the Sirt3 promoter (D), measured by the expression of the firefly luciferase. Neuro2a cells were co-transfected with PGC-1α isoforms (canonical PGC-1α, CNS-specific B4-PGC-1α and B5-PGC-1α; exon B4 or B5 are added at the N-terminus of canonical PGC-1α, respectively) and the renilla luciferase. Forty-eight hours after transfection the luciferase assay was performed. The activity of the firefly luciferase was normalized to the renilla luciferase activity and relative light units (RLU) are shown relative to the canonical PGC-1α levels. Data were analyzed using the Kruskal-Wallis test, followed by Dunn’s multiple comparison test with n = 8. Data are shown as mean ± SEM. ns = P > 0.05, *P ≤ 0.05, **P ≤ 0.01, ***P ≤ 0.001, ****P ≤ 0.0001.