
Figure 8.
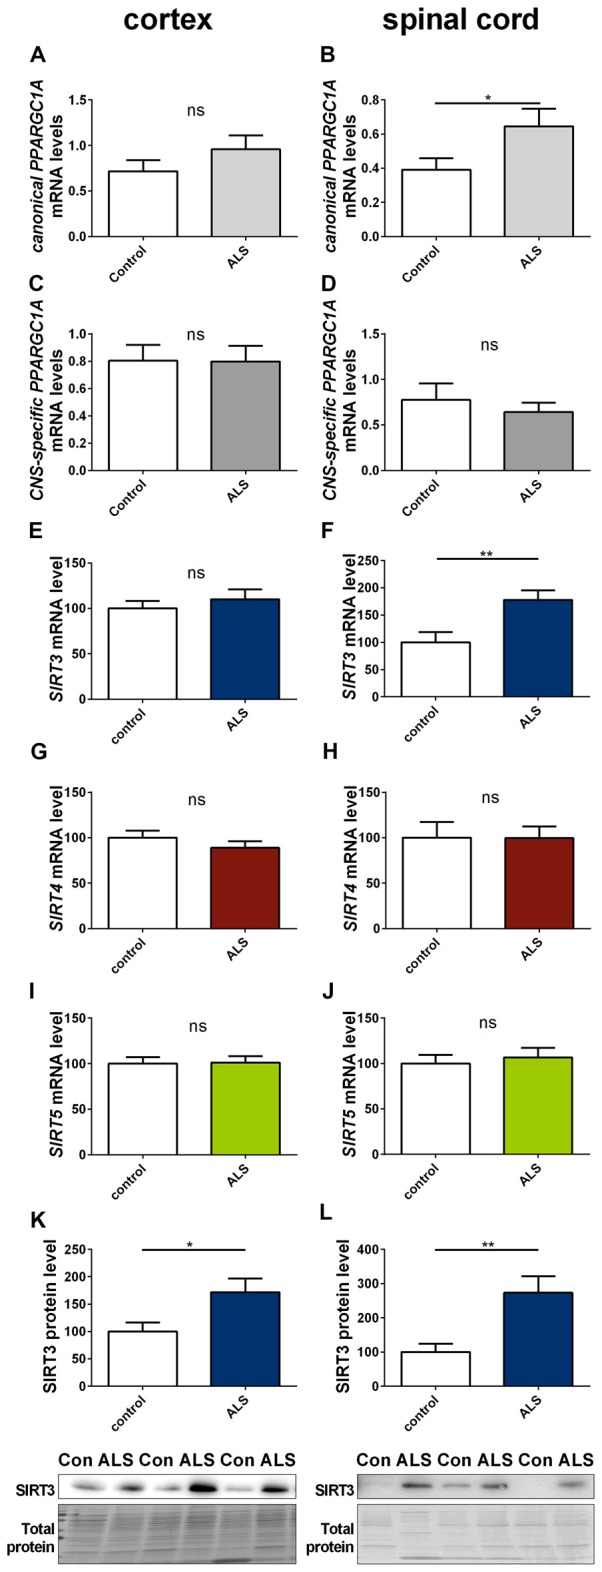
Sirt3 levels increase in human spinal cord of amyotrophic lateral sclerosis (ALS) patients. Human cortex (A,C,E,G,I,K) and spinal cord (B,D,F,H,J,L) were analyzed according to the canonical PPARGC1A (A,B), CNS-specific PPARGC1A (C,D), SIRT3 (E,F), SIRT4 (G,H) and SIRT5 (I,J) mRNA levels. mRNA levels were determined by qPCR and data was normalized to TBP and POLR2A, n = 10–12. SIRT3 protein levels were also determined in the human cortex (K) and spinal cord (L). Data was normalized to total protein amount determined by MemCode staining, n = 12–15. Analysis was performed by the nonparametric Mann-Whitney test. Data are shown as mean ± SEM. ns = P > 0.05, *P ≤ 0.05, **P ≤ 0.01.