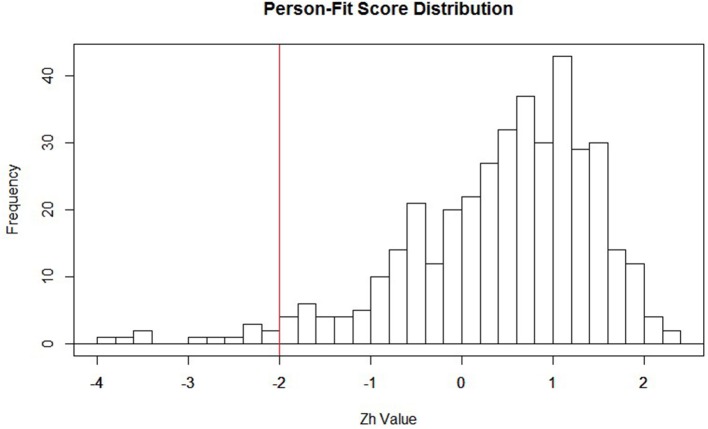
Figure 1.
Distribution of Zh values with −2 highlighted in red. This is not a strict cutoff; it is suggested researchers create a cutoff that best highlights important features of the distribution. For example, if the interest is in assessing over-fit, then the cutoff would be placed at the higher end of the distribution (e.g., around 2).

