FIGURE 2.
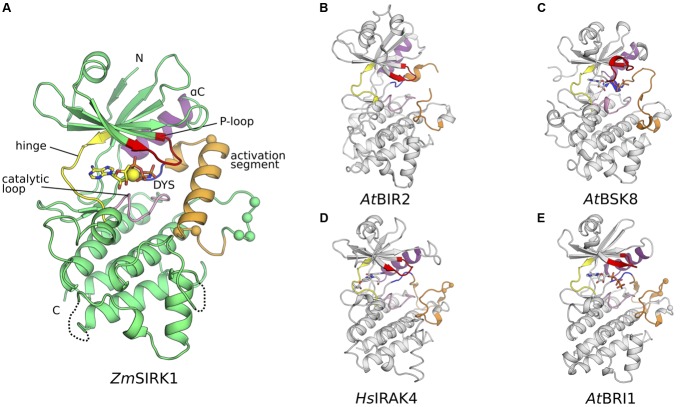
Co-crystal structure of ZmSIRK1 bound to AMP-PNP. (A) Cartoon representation of the ZmSIRK1-AMP-PNP structure. Protein regions were colored as follows: glycine-rich (P-)loop – red; hinge region – yellow; catalytic loop -pink; DYS (more commonly DFG) motif – blue; activation segment – orange; αC – purple. Other protein regions in green. AMP-PNP is shown in stick and Mg2+ ion as a yellow sphere. The Cαs from putative phosphorylation sites within and immediately C-terminal of ZmSIRK1 activation segment are shown as spheres. (B–E) Cartoon representation of ZmSIRK1 closest structural neighbors. (B) Crystal structure of AtBIR2 (PDB ID 4L68). (C) Crystal structure of AtBSK8 (PDB ID 4I92). (D) Crystal structure of HsIRAK4 (PDB ID 2NRY). (E) Crystal structure of AtBRI1 (PDB ID 5LPB). Protein regions colored as in (A). If present, ligands are represented as sticks and the Cαs from known phosphorylation sites as spheres.

