
FIGURE 5.
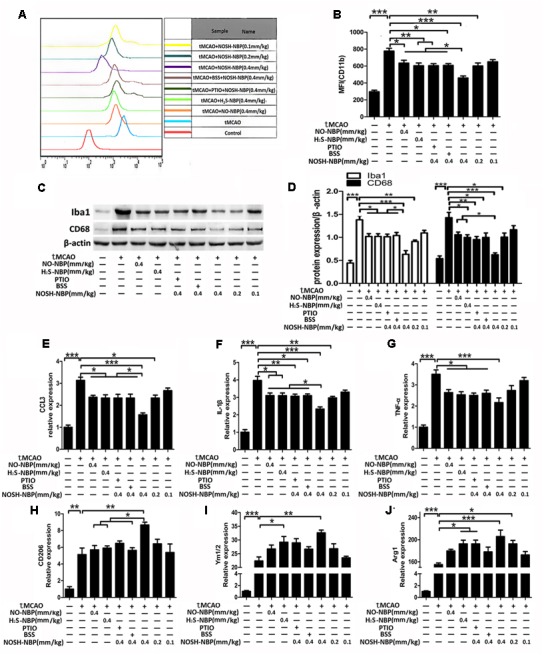
Effect of NO-NBP, H2S-NBP, and NOSH-NBP on microglia/macrophage activation and relative M1/M2 activation in ischemic brain. The model- and test compound-groups underwent tMCAO while the sham group underwent the same surgical procedure without the filament insertion. After MCAO being performed, mice in test compound-groups were administered with NO-NBP (0.4 mm/kg), H2S-NBP (0.4 mm/kg), NOSH-NBP (0.4 mm/kg) + PTIO, NOSH-NBP (0.4 mm/kg) + BSS or NOSH-NBP (0.4, 0.2, and 0.1 mm/kg) for 3 days. (A) A representative profile of CD11b expression. (B) Quantitative analysis of the mean fluorescence intensity (MFI) of CD11b (n = 3). (C) Representative Western blot membranes for lba1 and CD68. (D) Quantitative analysis of lba1 and CD68 protein expression levels (n = 3). Quantitative analysis of mRNA expression of the M1 markers (E) CCL3, (F) IL-1β and (G) TNF-α (n = 6). Quantitative analysis of mRNA expression of the M2 markers (H) CD206, (I) Ym1/2, and (J) Arg1 (n = 6). Data were expressed as the mean ± SD and were analyzed by one-way ANOVA followed by post hoc Tukey test: ∗∗∗P < 0.001, ∗∗P < 0.01, ∗P < 0.05.